
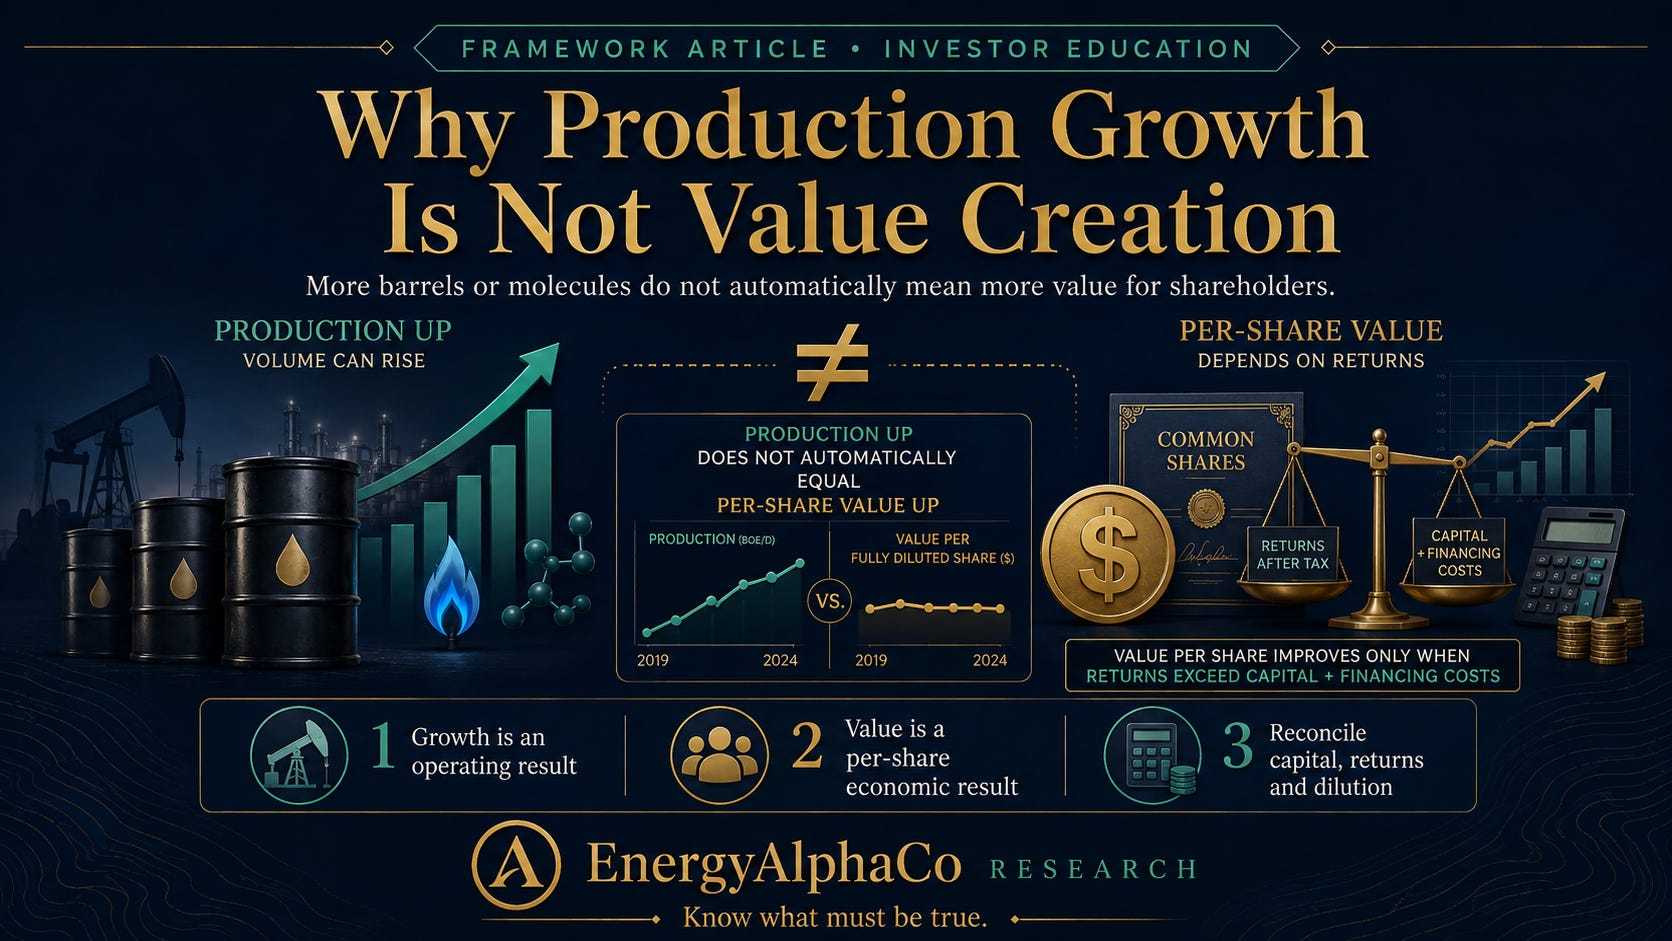
Why Production Growth Is Not Value Creation
More barrels or molecules do not automatically mean more value for shareholders.
FRAMEWORK ARTICLES / INVESTOR EDUCATION
Investment-learning conclusion
Production growth creates value only when the incremental cash returns exceed the full capital and financing cost of obtaining that growth—and when the result increases durable value per fully diluted share.
Why this matters
Production is one of the first figures investors see in an exploration-and-production earnings release. Management may highlight record volumes, rising barrels of oil equivalent, a larger acreage position or a higher exit rate. Those figures describe scale. They do not, by themselves, describe economics.
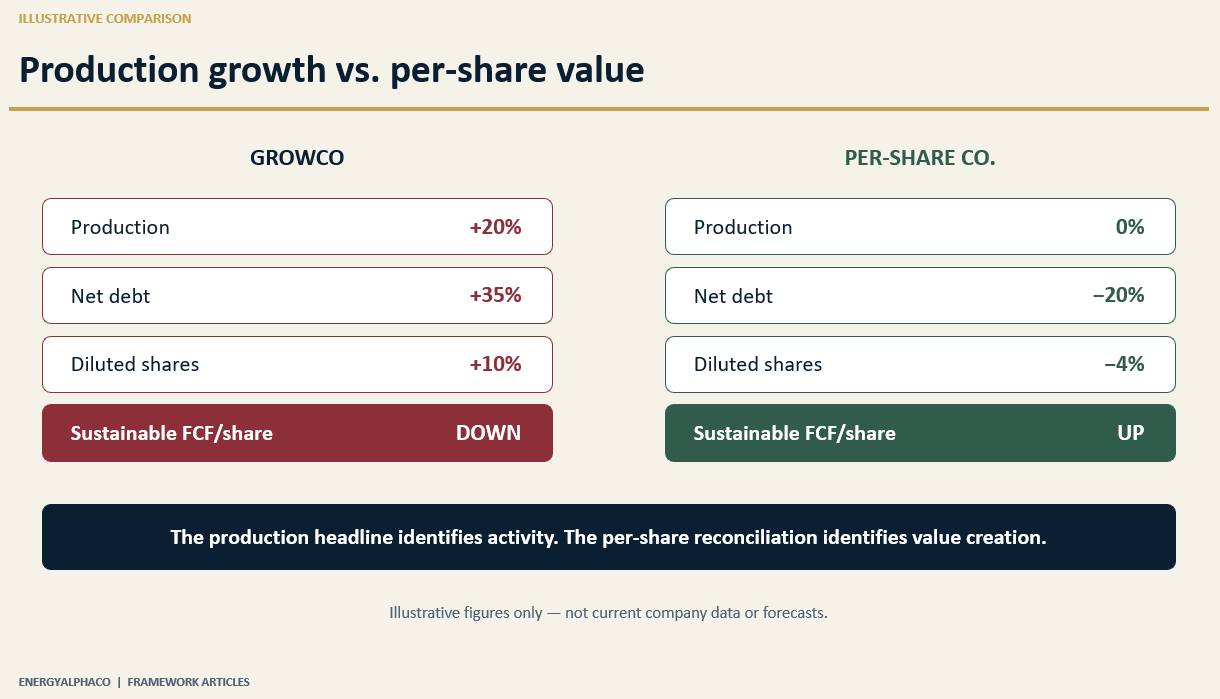
An E&P can grow production while earning weak returns, consuming its best inventory too quickly, increasing leverage or issuing enough equity that existing owners receive little benefit. Conversely, a company can hold production roughly flat, harvest free cash flow, reduce debt and repurchase shares at an attractive price—creating more per-share value than a faster-growing peer.

The common mistake: treating volume as the score
The usual shortcut is simple: more production means more revenue, more cash flow and therefore a more valuable company. The first two links can be true while the final conclusion is false. Investors must ask what the additional production cost, how it was financed, what margin it earned, how durable it is and how much of the benefit belongs to each share.
A high-decline asset may require heavy reinvestment merely to preserve the new production level.
Acquired production may increase cash flow but also bring debt, integration costs, future abandonment obligations or a larger share count.
Growth can be concentrated in lower-margin natural gas or NGL volumes while higher-margin oil remains flat.
A company may accelerate drilling when service costs are high or commodity prices do not support an adequate full-cycle return.
Enterprise value can rise while fully diluted value per share stagnates because the growth was financed with equity.
Production growth is therefore evidence to investigate—not a conclusion to celebrate.
The better framework: the six-part value-creation test
A disciplined analysis follows the incremental economics from the field to the shareholder. Each part of the test must be considered together; a favorable answer to only one or two questions is not enough.
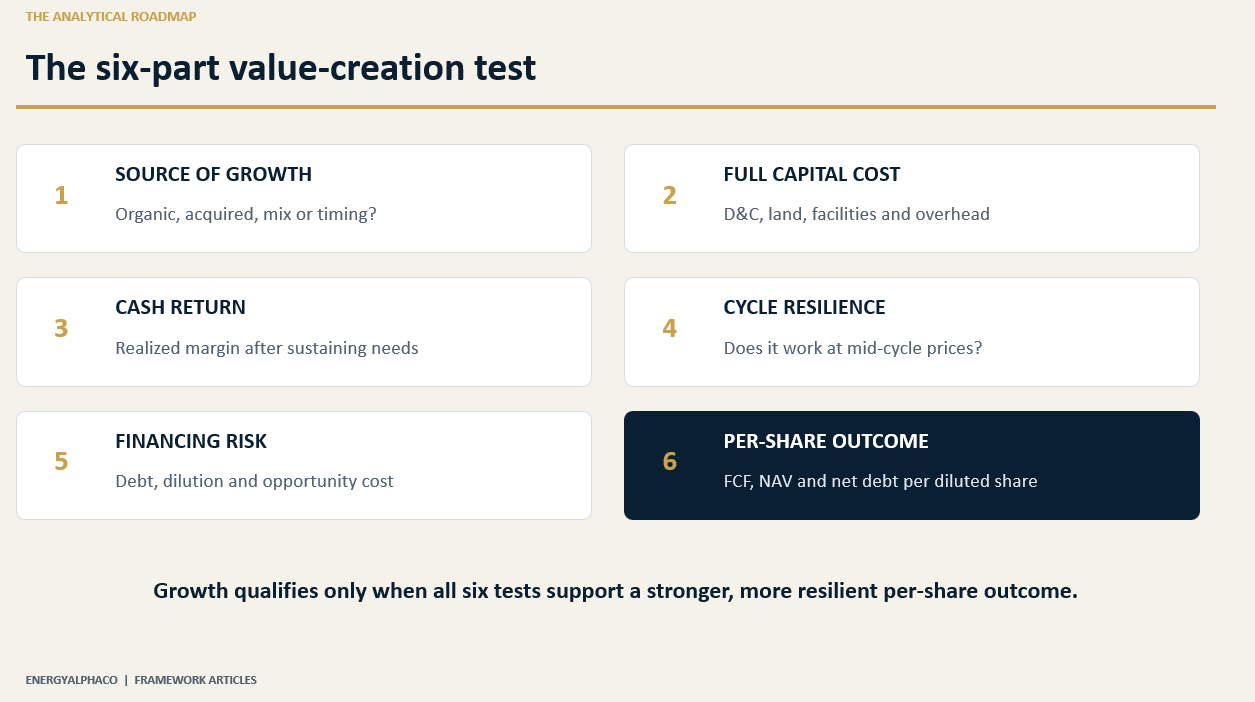
1. Identify the true source of growth. Separate organic drilling, improved uptime and productivity from acquisitions, commodity mix changes and accounting presentation. Organic and acquired growth can both create value, but they carry different capital, financing and execution risks.
2. Measure the full capital cost. Include drilling and completion spending, leasehold, facilities, gathering, water, infrastructure and corporate overhead required to support the program. For acquisitions, include the purchase price, assumed debt, transaction costs and integration spending. A low drilling cost does not prove a low full-cycle cost.
3. Estimate the incremental cash return. Translate added volumes into realized revenue after basis differentials, hedges, royalties and transport. Subtract operating costs, production taxes, cash interest and the capital needed to sustain the increment. The relevant question is not whether EBITDA rises, but whether the cash return adequately compensates shareholders for the capital and risk.
4. Test resilience across the commodity cycle. A growth project that clears its hurdle rate only at a favorable spot price is fragile. Evaluate the economics under conservative, base and strong commodity prices, and consider regional basis, service-cost inflation and timing. Mid-cycle returns matter more than a single high-price quarter.
5. Account for financing and balance-sheet risk. Debt-funded growth transfers more of the downside to the equity if prices fall. Equity-funded growth can protect liquidity but dilute existing owners. Internally funded growth may still be unattractive if it displaces debt reduction or high-return buybacks. Capital is never free merely because it came from operating cash flow.
6. Measure the outcome per fully diluted share. Compare production, sustainable free cash flow, net asset value and net debt on a fully diluted per-share basis. A larger company is not necessarily a more valuable investment. Existing owners benefit only if the value created exceeds the value surrendered through debt, dilution and inventory consumption.
Maintenance capital and growth capital are different—but connected
E&P production naturally declines as reservoir pressure falls. Before a company can grow, it must first replace the decline from its existing wells. The capital needed to keep production approximately flat is commonly called maintenance capital. Spending above that level may be described as growth capital.
The distinction is analytically useful, but it is rarely clean. Maintenance capital is generally a management estimate rather than an audited line item. It changes with decline rates, well productivity, commodity mix, service costs, infrastructure availability and the timing of completions. A company can make its growth program look more attractive by understating how much capital is actually required to sustain the starting production base.
A practical test is to compare multi-year capital spending with the production trajectory. If the company repeatedly spends at or above its claimed maintenance level while volumes decline, the maintenance estimate deserves skepticism. If flat production requires more capital as the inventory matures, the economic cost of growth is rising even if reported well costs appear stable.

Four ways production can grow—and four different shareholder outcomes
The source and financing of growth materially affect its quality. The following framework is not a ranking; each route can create or destroy value depending on price, capital efficiency and execution.
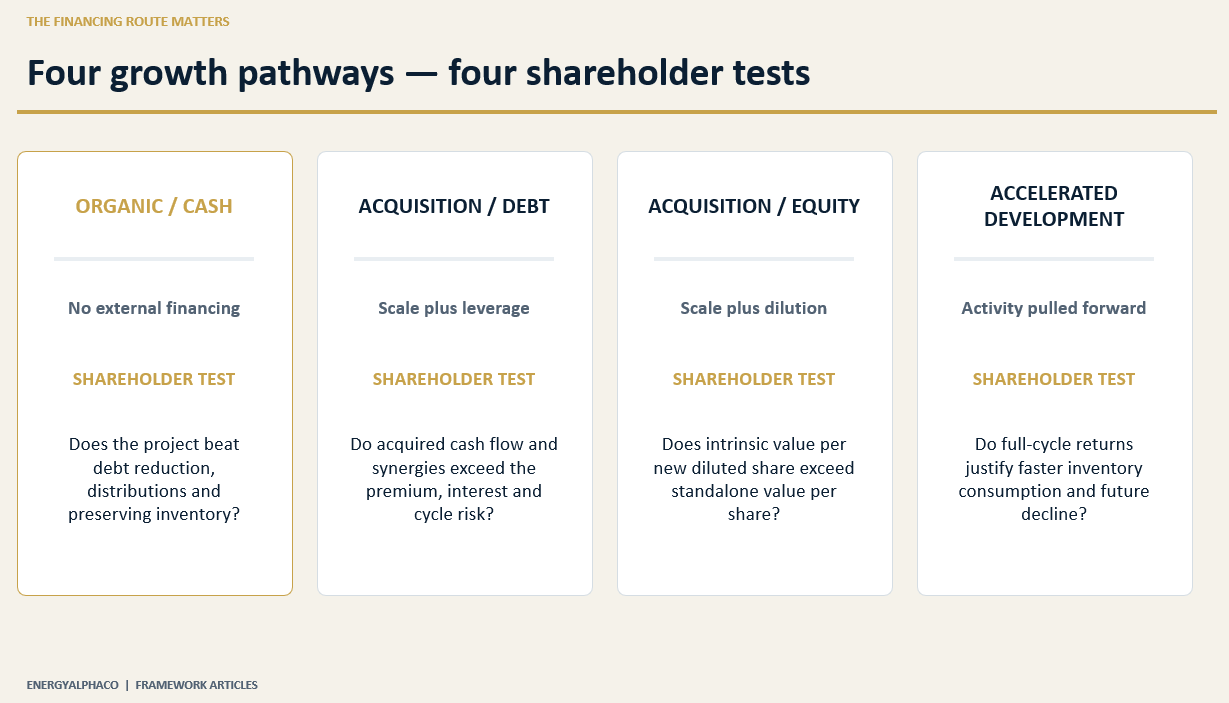
Organic growth funded from cash flow
This is often viewed as the cleanest form of growth because it avoids new debt or equity. But it still consumes shareholder capital. The program should earn more than reasonable alternatives, including debt reduction, dividends, repurchases or simply preserving inventory for a better commodity environment.
Debt-funded acquisition growth
An acquisition can add scale, infrastructure and high-quality inventory quickly. The shareholder test is whether synergies and acquired cash flow exceed the purchase premium, interest cost and integration risk across the cycle. Lower leverage must be demonstrated with actual free cash flow; it should not depend entirely on optimistic commodity prices.
Equity-funded acquisition growth
Issuing shares can reduce financing risk and may be sensible when the buyer’s stock is expensive relative to the acquired assets. But production growth should be evaluated per share. If production rises 30% while fully diluted shares rise 35%, existing owners begin with less production per share before considering costs, debt or synergies.
Accelerated development growth
Pulling activity forward can increase near-term production and cash flow, but it may consume premium locations faster, raise service costs or create a steeper future decline. The correct metric is not the first-year production response; it is the full-cycle return and the value of the remaining inventory.
The metric hierarchy: from production to per-share value
No single metric proves value creation. Investors should move through a hierarchy, with each level correcting a weakness in the one above.
Total production. Useful for scale, but it ignores commodity mix, financing and share count.
Production per share. Better, but it still ignores margins, capital intensity, leverage and asset quality.
Cash flow per share. Closer to the economic result, but can overstate value if the company underinvests or benefits from temporary working-capital movements.
Sustainable free cash flow per share. Adjusts for the capital required to maintain the asset base, but depends on a credible maintenance-capital estimate and normalized commodity assumptions.
Risk-adjusted net asset value per fully diluted share. Incorporates the balance sheet, future inventory, development timing and risk. It is the most complete test, but also the most assumption-dependent and should be presented as scenarios rather than false precision.
A simplified illustrative example
Consider two hypothetical natural-gas producers. These figures are EnergyAlphaCo illustrations, not current company data or forecasts.
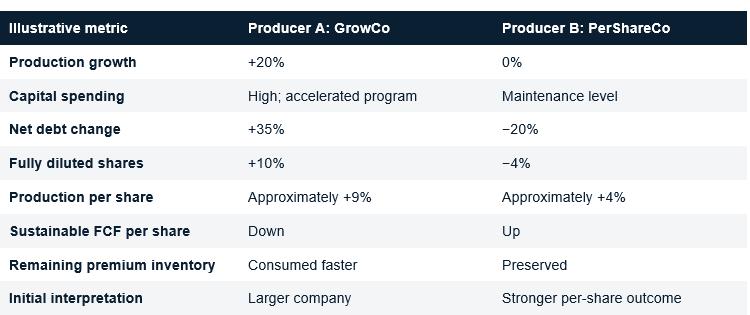
Producer A may ultimately succeed if the new wells outperform, commodity prices strengthen and debt falls rapidly. Producer B may destroy value if it underinvests and its asset base deteriorates. The illustration does not declare a winner; it shows why the production-growth headline is insufficient. The next task is to test the assumptions and monitor the evidence.
How acquisition growth can conceal dilution
Acquisitions are especially vulnerable to misleading scale comparisons. Management may correctly state that production, EBITDA and inventory increased. Yet the transaction can still be dilutive if the buyer paid too high a price, issued too many shares, assumed expensive debt or overestimated synergies.
The basic reconciliation is straightforward: calculate the incremental after-tax cash flow and risk-adjusted asset value acquired; subtract debt, transaction costs and integration spending; then divide the combined equity value by the new fully diluted share count. Compare that result with the buyer’s standalone per-share value. Accretion to adjusted EBITDA per share is not the same as accretion to intrinsic value per share.
This distinction is particularly important near the top of a commodity cycle, when both seller expectations and debt capacity may be inflated by favorable prices. A transaction that looks inexpensive on peak EBITDA can be expensive on normalized free cash flow.
What investors should monitor
Production by commodity and basin, including organic growth versus acquired volumes.
Production per fully diluted share—not only total BOE or total company revenue.
Capital spending per unit of added production and the multi-year production response.
Management’s maintenance-capital estimate versus actual decline, activity and production history.
Realized pricing after basis differentials, hedges, royalties and transportation.
Incremental operating margin and sustainable free cash flow under conservative, base and strong commodity prices.
Net debt, interest expense, covenant headroom and the pace of post-growth deleveraging.
Basic and fully diluted shares, including stock compensation, warrants, convertibles and acquisition consideration.
Well productivity, decline rates and inventory quality—not merely the number of remaining locations.
Return on capital and free cash flow per share over a multi-year period rather than a single quarter.
Management compensation: whether incentives reward total growth, per-share returns, balance-sheet strength or a combination.
What management gives up to fund growth: debt reduction, distributions, buybacks or future drilling optionality.
Common mistakes to avoid
Comparing production growth without comparing capital intensity: A 10% volume increase is less impressive if it requires a disproportionately larger capital budget.
Ignoring commodity mix: Growth in lower-margin gas or NGL volumes may contribute less value than the same percentage increase in oil.
Using EBITDA accretion as proof of value creation: EBITDA excludes capital intensity, interest, taxes and the cost of inventory depletion.
Treating internally generated cash as free capital: Operating cash belongs to shareholders and has alternative uses. The growth project still needs to clear an appropriate return hurdle.
Accepting maintenance capital as a verified fact: It is usually an estimate. Test it against decline rates, well performance and the production trajectory.
Ignoring the timing of returns: A project can show an acceptable undiscounted return while destroying present value because cash arrives late or requires years of funding.
Measuring the company instead of the share: Enterprise value and production can rise while the ownership and value attributable to each share fall.
Assuming deleveraging will occur: Model it under realistic commodity prices and verify it quarter by quarter.
Rewarding growth that consumes the best inventory first: Near-term volumes may rise while the quality and duration of the remaining asset base deteriorate.
Confusing a favorable commodity price with operating skill: Separate the return from the asset and capital program from the benefit of the price environment.
Questions to ask when management promises growth
How much capital is required to sustain the starting production level before any growth occurs?
What realized commodity prices and basis differentials are required for the growth program to clear its return hurdle?
Is the return calculated on drilling-and-completion cost only, or on full-cycle capital including land and infrastructure?
How will the program be funded, and what happens to leverage and the fully diluted share count?
What does production, free cash flow and net asset value look like per share after the plan?
How much premium inventory will be consumed, and what will replace it?
What evidence over the next four to eight quarters would prove that the plan is working?
What commodity, cost, productivity or financing outcome would cause management to slow the program?
Final takeaway
Production growth is neither inherently good nor inherently bad. It is a use of capital. The analytical task is to determine whether the additional barrels or molecules earn an adequate full-cycle return, survive a reasonable commodity downside, preserve balance-sheet flexibility and increase durable value per fully diluted share.
The strongest growth plan is not necessarily the fastest. It is the one that converts high-quality inventory into incremental cash returns without paying too much for scale, taking excessive financing risk or diluting away the benefit. In some periods, disciplined maintenance and debt reduction will create more value than growth. In others, accelerating development or acquiring assets will be rational because returns are unusually attractive.
The correct conclusion must come from the economics—not from the production headline. That is the difference between measuring activity and auditing value creation.
Educational disclosure
This material is for informational and educational purposes only and does not constitute individualized investment advice or a recommendation to buy or sell any security. Energy and commodity investments involve substantial risk, including commodity-price volatility, operating risk, leverage, dilution and loss of capital. Illustrative figures are simplified examples, not forecasts or representations of a specific company. The author may hold positions in securities discussed by EnergyAlphaCo. Readers should perform their own research and consider their objectives and risk tolerance.