
The U.S. Gas Setup: Why LNG, Power Demand and Storage Matter for Equity Investors
The demand outlook is strengthening, but gas-equity returns will depend on whether supply growth can keep pace—and which companies actually convert higher prices into free cash flow.

Investment conclusion
The U.S. natural-gas investment case is becoming more compelling, but it is also more complicated than the simple claim that LNG exports and data centers will drive Henry Hub prices sharply higher.
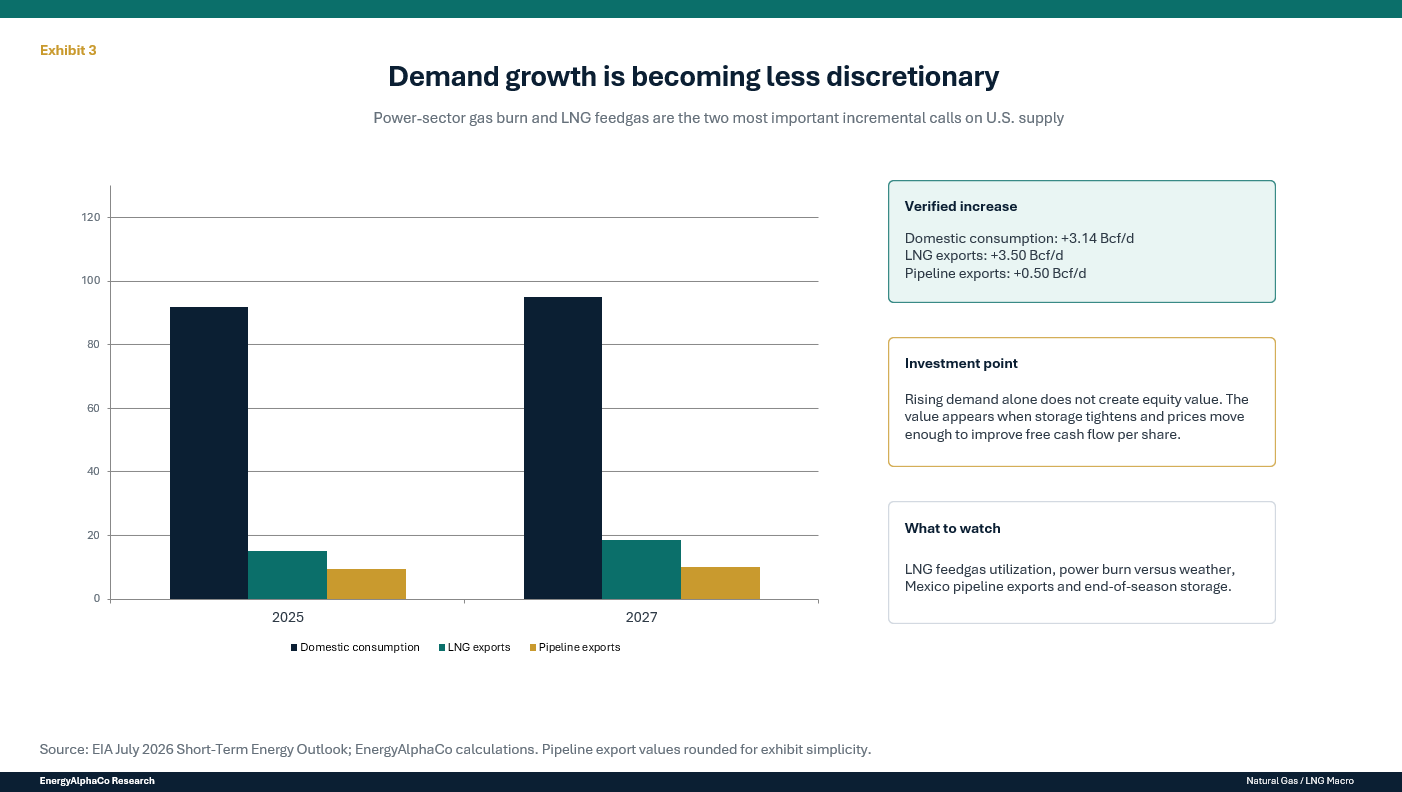
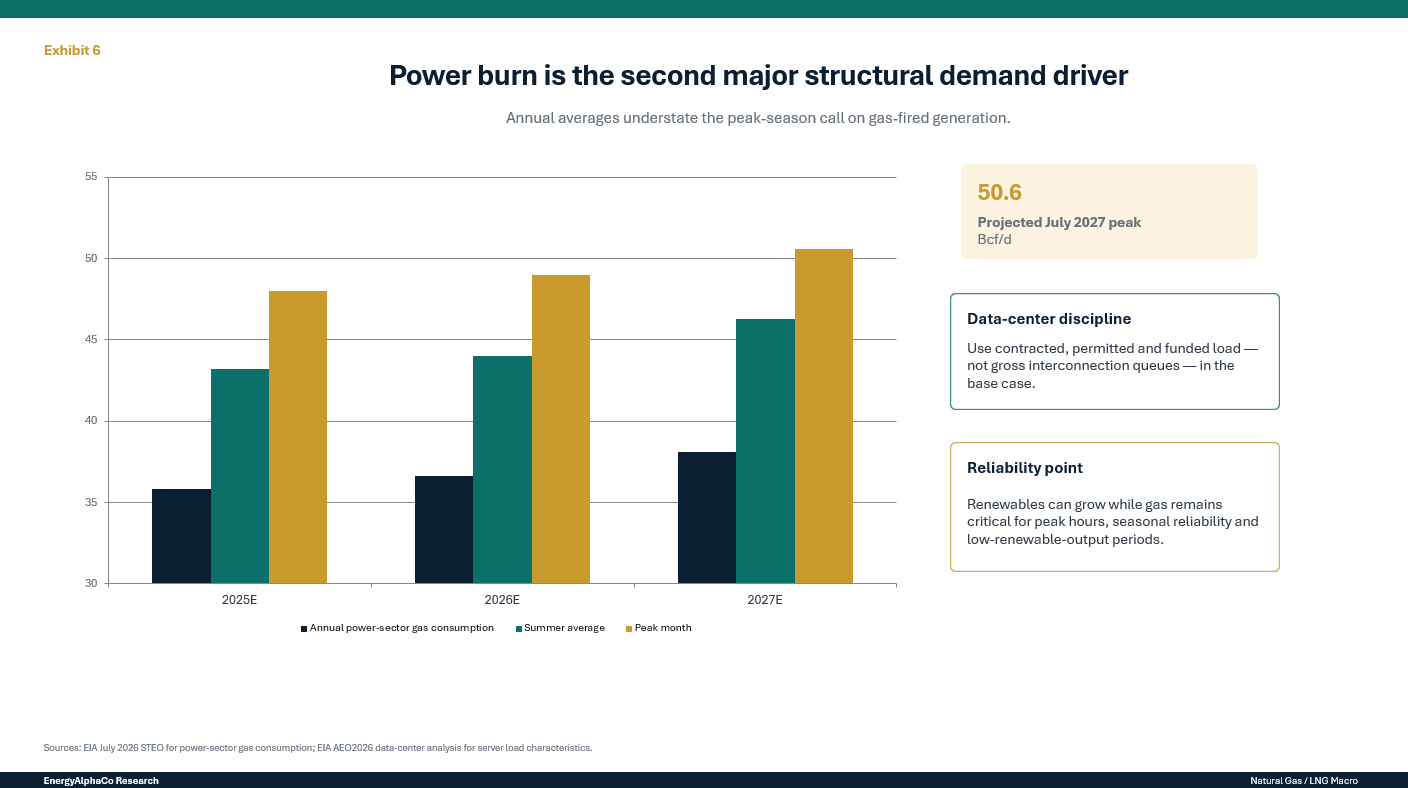
The verified demand story is substantial. The U.S. Energy Information Administration expects LNG exports to rise from 15.1 Bcf/d in 2025 to 18.6 Bcf/d in 2027. Total domestic gas consumption is forecast to increase by another 3.1 Bcf/d over the same period, with the electric-power sector accounting for most of the growth. By July 2027, the EIA expects gas consumption by power plants to reach a monthly record of 50.6 Bcf/d.
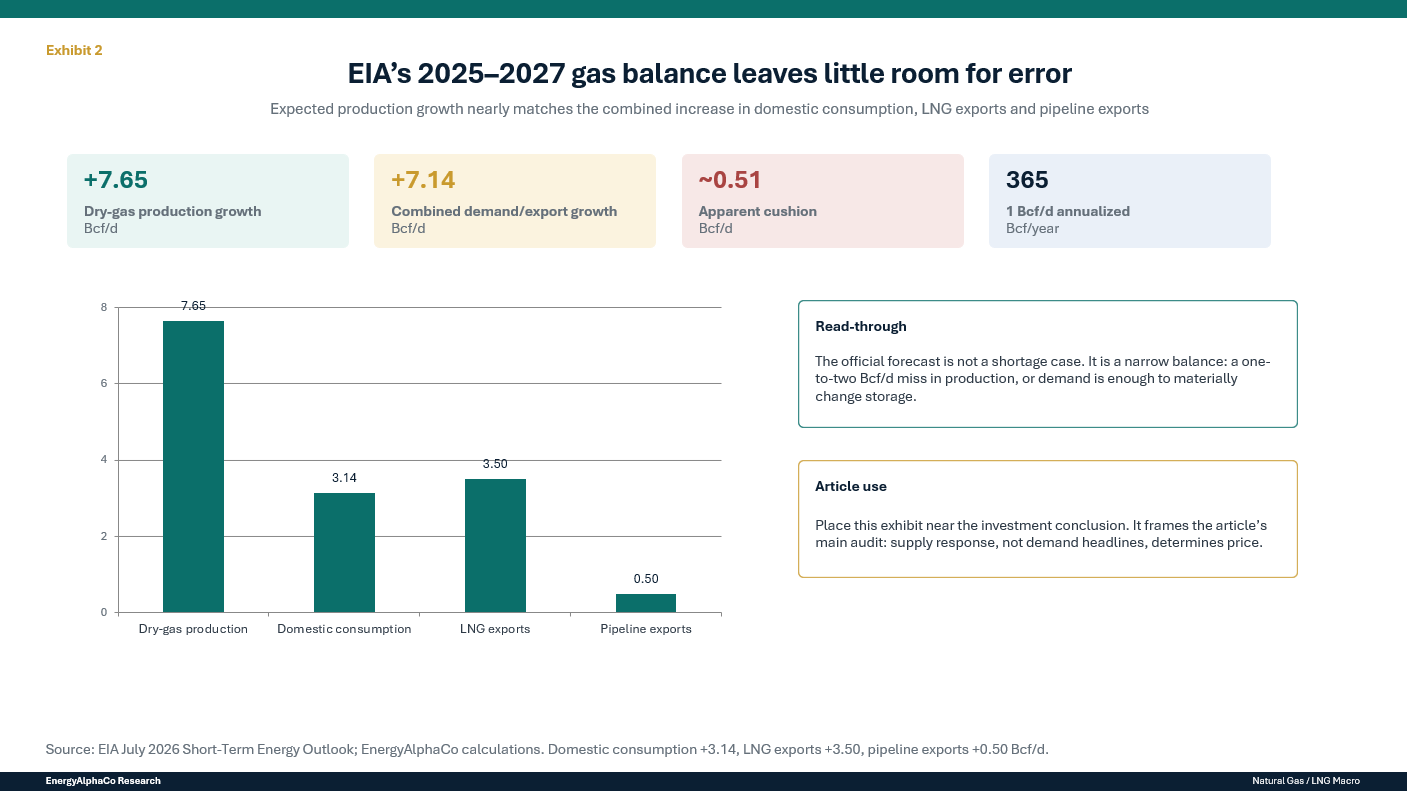
The less comfortable fact for natural-gas bulls is that the EIA also expects dry-gas production to increase from 107.65 Bcf/d in 2025 to 115.30 Bcf/d in 2027. That 7.65 Bcf/d increase would be sufficient, on paper, to absorb the combined 6.64 Bcf/d increase in domestic consumption and LNG exports, before accounting for pipeline trade and inventory changes. The official base case is therefore not a shortage. It is a market in which record production largely keeps pace with record demand and Henry Hub averages approximately $3.49/MMBtu in 2027.
That forecast defines the real investment question:
Will U.S. producers deliver more than 7 Bcf/d of incremental dry-gas supply by 2027 at Henry Hub prices in the mid-$3 range, without requiring materially greater capital, leverage or equity issuance?
EnergyAlphaCo’s preliminary conclusion is that the market may be placing too much confidence in a smooth and inexpensive supply response. The expected balance leaves limited room for weather volatility, LNG commissioning delays or accelerations, pipeline constraints, disappointing well productivity, producer discipline or changes in associated-gas output.
This does not automatically imply a return to $6–$10 gas. The more defensible investment case is that the probability distribution has shifted: sustained sub-$3 pricing becomes harder to maintain as LNG and power demand grow, while modest supply disappointments can move inventories and prices much more rapidly than they could in an oversupplied market.
For equity investors, the best opportunities will not necessarily be the companies with the largest gas reserves or the most ambitious production targets. The more important questions are:
How much unhedged exposure does the company retain?
What realized price does it receive after basis and transportation?
How much capital is required to maintain production?
Can incremental cash flow reduce net debt or the share count?
Are LNG or infrastructure projects protected by long-term contracts?
Is a high distribution funded by durable free cash flow or by cyclical pricing?
The U.S. gas setup is favorable enough to justify a constructive sector view. It is not yet tight enough to suspend discipline.
The setup in one paragraph
U.S. natural gas is being pulled in several directions at once. LNG terminals are connecting Gulf Coast supply to global markets. Electricity demand is rising after years of limited growth, driven partly by data centers, manufacturing and electrification. Gas-fired generation remains essential when power demand peaks or renewable output is insufficient. Industrial gas use is also expected to set records.
Against those demand additions, the Permian Basin continues to generate associated gas as a byproduct of oil drilling, the Haynesville can respond directly to higher gas prices, and Appalachia retains enormous low-cost resources but faces transportation limitations. Storage sits between these forces. When storage is comfortable, the market can absorb production growth and weather volatility without a major price response. When storage falls toward or below normal, the same demand additions can produce a very different price outcome.
Why the opportunity may exist
Natural-gas equities are difficult investments because the underlying commodity has repeatedly punished investors who treated long-term demand forecasts as near-term price forecasts.
Demand can rise while prices fall. LNG terminals can enter service while storage remains above normal. Data-center projects can be announced but never receive power, financing or permits. Producers can improve well productivity just as investors expect depletion to tighten supply. Associated gas can continue flowing even when the natural-gas price itself provides little incentive to drill.
This history has conditioned the market to discount bullish gas forecasts. That skepticism is justified.
But it may now be obscuring a genuine change in the market’s structure. The U.S. gas system is being asked to serve a larger amount of demand that is either highly utilized, difficult to interrupt or strategically important. LNG plants are designed to run at high utilization when global netbacks support exports. Data centers and industrial facilities generally require reliable, continuous electricity. Gas-fired power plants provide dispatchable generation when the grid needs it rather than only when weather conditions allow it.
At the same time, the futures curve is not pricing a sustained shortage. As of July 11, the August 2026 Henry Hub contract was below $3/MMBtu, while January 2027 traded around $4.24/MMBtu. The curve recognizes winter risk but does not imply that a structural scarcity premium has become embedded across the year.
That creates a reasonable contrarian setup—not because the market is ignoring LNG or power demand, but because it may be assuming that production growth will arrive with fewer operational, financial and infrastructure constraints than ultimately prove realistic.
Verified facts versus the EnergyAlphaCo thesis
Verified facts
The EIA forecasts dry-gas production rising by 7.65 Bcf/d from 2025 through 2027.
The EIA forecasts domestic consumption increasing by 3.14 Bcf/d over the same period.
LNG exports are forecast to increase by 3.5 Bcf/d.
Electric-power-sector consumption is forecast to reach a record 38.1 Bcf/d on an annual basis in 2027.
Working gas in storage was 2,983 Bcf on July 3, 2026, which was 185 Bcf above the five-year average.
The EIA expects end-October storage to remain 5% above the five-year average in 2026 but only 1% above it in 2027.
The EIA’s current 2027 Henry Hub forecast is approximately $3.49/MMBtu.
EnergyAlphaCo interpretation
The official forecast is internally consistent, but the balance is more fragile than the headline production number suggests. A production miss of only 1–2 Bcf/d, or an equivalent demand surprise, would consume much of the projected cushion and could bring storage below normal.
EnergyAlphaCo assumptions
Our scenario framework assumes that:
LNG facilities that are already operating or under advanced construction are more credible demand sources than announced projects without financing or final investment decisions.
Contracted and permitted power projects deserve more weight than gross data-center interconnection queues.
Haynesville supply is responsive to price, but the capital required to offset steep declines matters.
Associated Permian gas is the largest downside risk to a bullish Henry Hub thesis.
Appalachia possesses ample low-cost resources, but pipeline capacity limits how rapidly those resources can reach Gulf Coast and southeastern demand centers.
Storage relative to weather-adjusted norms is a more reliable near-term price signal than any multiyear demand forecast.
LNG is creating a durable step-up in U.S. gas demand
The U.S. LNG industry has moved beyond the stage where exports are a small, optional outlet for domestic gas.
The EIA expects LNG exports to average 17.4 Bcf/d in 2026 and 18.6 Bcf/d in 2027, up from 11.9 Bcf/d in 2024. April 2026 exports reached 17.9 Bcf/d, 20% above April 2025 and the highest April rate in the EIA’s data.
FERC reported that authorized liquefaction capacity totaled approximately 14.5 Bcf/d across eight operating export facilities as of April 2026, with three additional facilities exporting LNG while commissioning. The distinction between authorized nameplate capacity and actual feedgas demand is important: commissioning facilities can consume substantial gas before reaching stable commercial operation, and individual trains ramp at different rates.
Several projects underpin the next stage of growth:
Additional Corpus Christi Stage 3 capacity
Continued ramp-up at Plaquemines
Golden Pass
Port Arthur LNG
Rio Grande LNG
Smaller expansions at existing facilities
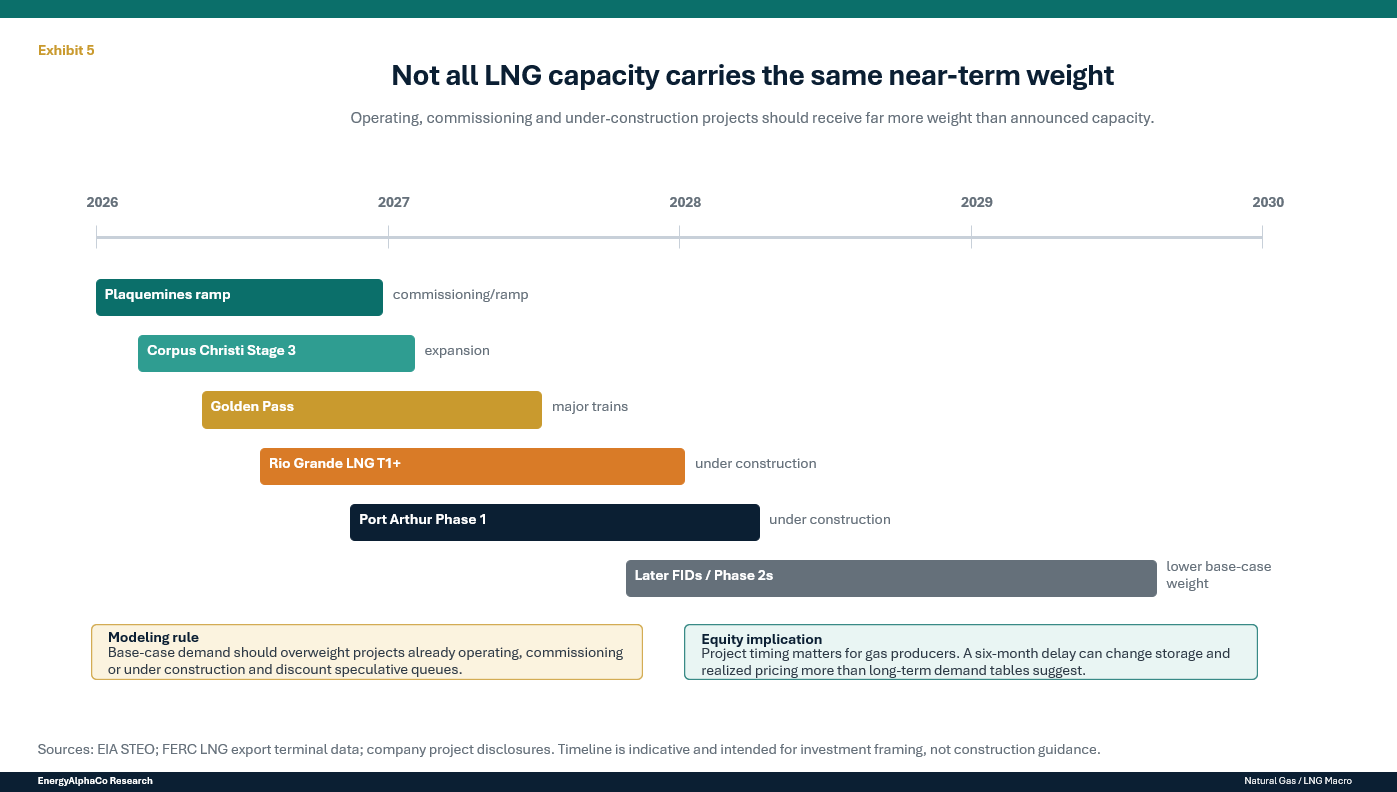
These are not all equivalent. An operating expansion at an established terminal has a different risk profile from a multibillion-dollar greenfield project that still requires construction, financing and customer commitments.
NextDecade, for example, expects first gas into its Rio Grande LNG facility during the second half of 2026 and first LNG production from Train 1 during the first half of 2027. Trains 1 through 5 are under construction, but their completion percentages and commercial start dates vary materially. The project therefore represents credible future demand, but not an instantaneous 30-MTPA addition to the U.S. gas balance.
LNG does not mean complete price convergence
U.S. natural-gas prices will not simply converge with European or Asian benchmarks.
The price gap must cover liquefaction charges, pipeline transportation, fuel consumption, shipping, regasification and other costs. Terminal capacity is finite, and much of the capacity is governed by long-term contracts. Once terminals are highly utilized, additional overseas demand cannot immediately pull more U.S. gas into the global market.
The more accurate conclusion is that LNG creates a progressively larger and more persistent call on U.S. supply. It raises the quantity of gas that must be produced, transported and stored before the domestic market is balanced.
It also changes the consequences of outages. When a major LNG terminal unexpectedly shuts down, feedgas demand can fall abruptly and domestic gas can accumulate in storage. When a terminal returns or a new train enters service, the reverse can occur. LNG therefore adds structural demand but can also increase short-term volatility.
Global LNG is not a one-way bullish story
The International Energy Agency estimates that approximately 345 billion cubic meters per year of new LNG export capacity is scheduled to enter service between 2025 and 2030 from projects that had already reached final investment decision and were under construction. This is the largest LNG capacity wave in the industry’s history.
That wave can support U.S. feedgas demand while simultaneously putting downward pressure on global LNG prices. Lower international prices may encourage additional demand in emerging markets, but they may also reduce the economics of uncontracted cargoes and weaken the case for marginal future projects.
The Middle East disruptions of 2026 demonstrate the opposite risk. The IEA reported that LNG loadings from Qatar and the United Arab Emirates fell sharply between March and June, with higher North American and African output offsetting much—but not all—of the decline. International prices rose, reinforcing the strategic importance of U.S. supply.
EnergyAlphaCo does not assume that geopolitical disruptions persist indefinitely. They should be treated as upside volatility, not as the foundation of a long-term valuation.
Power demand could become as important as LNG
LNG receives most of the attention because export terminals are visible, measurable and concentrated. Power demand may ultimately be just as important because it is geographically broader and connected to several simultaneous trends.
The EIA expects total U.S. gas consumption to increase by 3.1 Bcf/d between 2025 and 2027. The power sector accounts for approximately 2.3 Bcf/d of that increase. Annual gas use by power generators is projected to reach 38.1 Bcf/d in 2027, while summer consumption is expected to average 46.3 Bcf/d.
The EIA identifies three principal drivers:
Rising total electricity demand
Additional gas-fired generating capacity
Relatively low natural-gas prices
Gas-fired generating capacity is forecast to reach 508 GW by the end of 2027, approximately 3% above 2025. Renewable generation is expected to supply much of the increase in total generation, but natural gas still grows because it can operate during periods of high demand and lower renewable output.
Data centers are real, but project queues are not demand forecasts
The EIA estimates that servers accounted for approximately 7% of commercial-sector electricity consumption in 2025. Depending on the long-term scenario, that share could reach 22%–33% by 2050.
The investment error would be to convert every announced gigawatt of data-center capacity directly into gas demand.
Large-load development queues contain overlapping proposals, projects with uncertain financing, speculative site applications and customers evaluating multiple locations. Some projects will be served by renewables, nuclear generation, batteries or grid purchases rather than dedicated gas plants. Others will be delayed by transmission, transformer, turbine, permitting or water constraints.
A disciplined gas-demand model should therefore classify power projects by development stage:
Operating or under construction
Contracted and fully financed
Permitted with identified power supply
Announced or included in an interconnection queue
Conceptual
Only the first three categories should receive substantial weight in a base-case commodity forecast.
Reliability strengthens gas demand even when renewables grow
The natural-gas thesis does not require renewable development to fail.
Solar and wind can add large amounts of annual generation while gas plants remain essential for peak hours, seasonal reliability and periods of low renewable output. A gas plant that operates at a moderate annual capacity factor can still consume very large quantities during heat waves or grid emergencies.
This helps explain why gas demand can become more weather-sensitive even as renewable generation expands. The system may need less gas during ordinary hours but substantially more during critical periods.
For investors, that creates two different opportunities:
Higher average gas consumption over time
Higher price volatility when demand peaks and storage is constrained
The second can matter more to unhedged producers than the first.
Storage is the bridge between demand growth and price
LNG, data centers and production forecasts do not directly determine Henry Hub prices. Storage translates the cumulative balance into price signals.
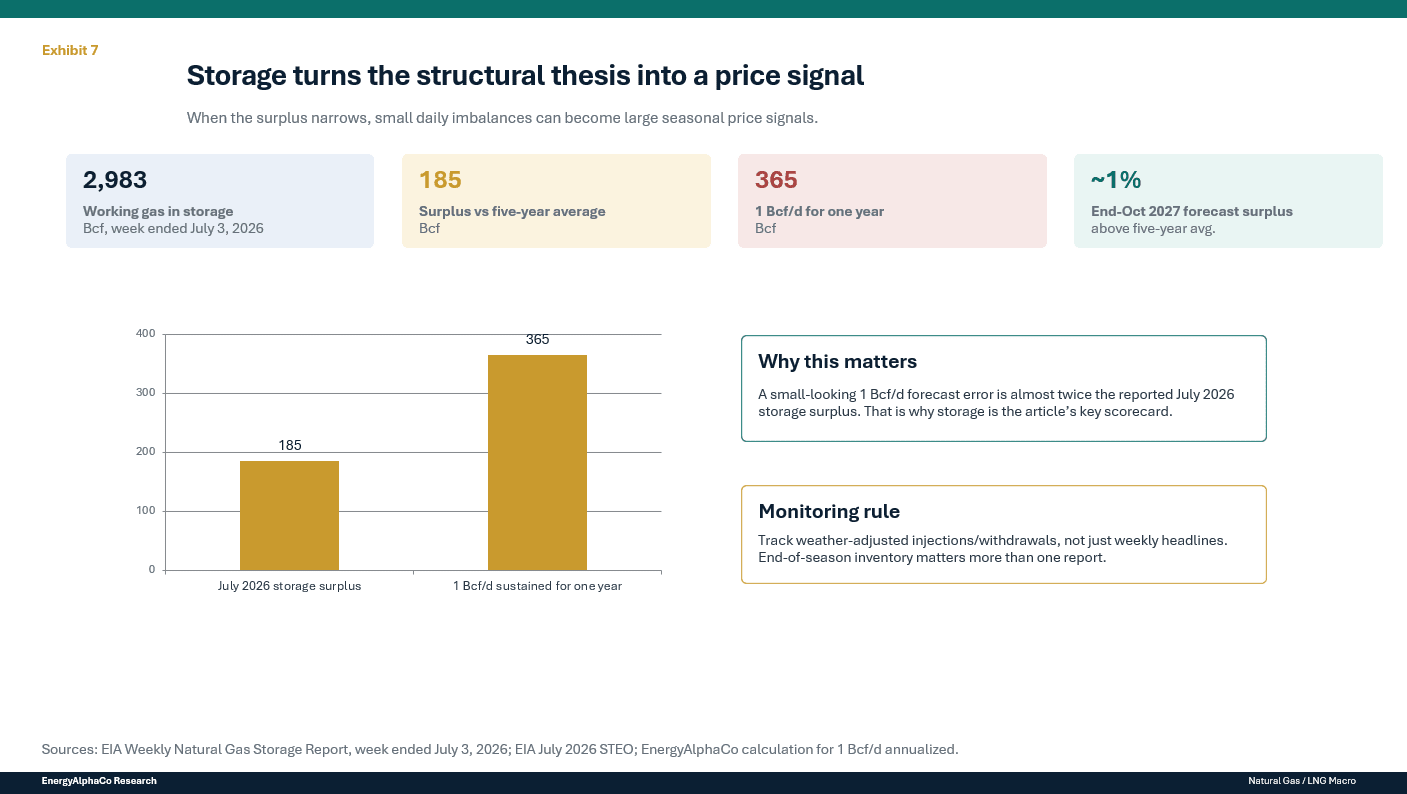
Working gas in storage stood at 2,983 Bcf on July 3, 2026. That was 185 Bcf, or approximately 7%, above the five-year average and within the historical five-year range.
The EIA expects inventories to reach 3,966 Bcf by the end of October 2026, approximately 5% above the five-year average. By October 2027, the projected surplus narrows to 1%.
This forecast captures the central tension in the gas market.
The absolute quantity of demand is growing rapidly, but the system begins with a storage cushion and is expected to receive record production. As long as the cushion remains intact, prices can stay moderate despite bullish structural headlines.
Once the cushion approaches zero, forecast errors become much more important.
Why small balance changes matter
A sustained 1 Bcf/d imbalance equals approximately 365 Bcf over a year.
That is almost twice the 185 Bcf storage surplus reported on July 3. It means that a seemingly modest error in production, LNG feedgas, power demand or weather can convert an above-normal storage position into a below-normal one within a year.
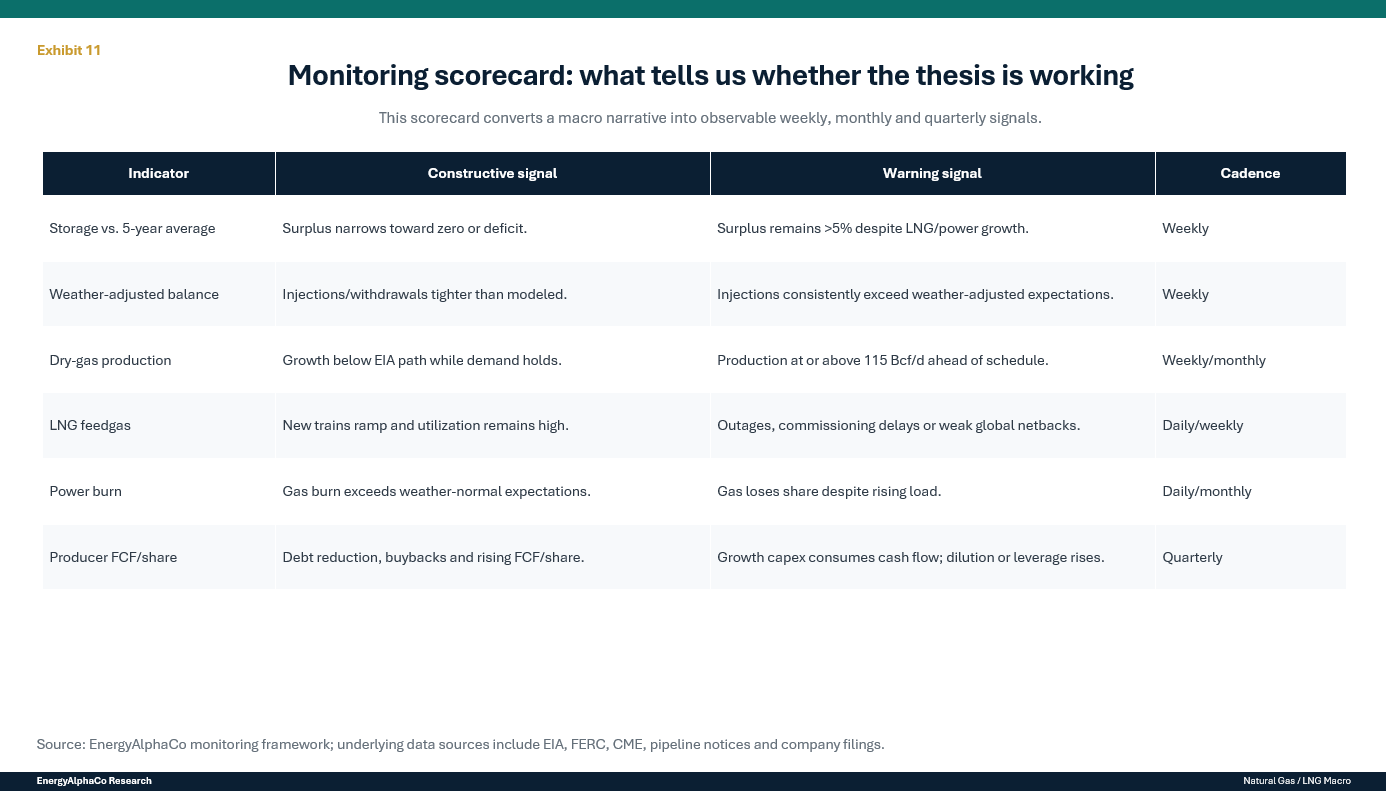
Storage should therefore be monitored in three ways:
Absolute inventory: How much gas is physically available?
Deviation from normal: Is inventory above or below the comparable five-year average?
Weather-adjusted balance: Are weekly injections or withdrawals stronger or weaker than weather alone would imply?
The third measure is often the most useful. A large injection during mild weather may not be bearish if it is smaller than temperature-adjusted expectations. A small injection during extreme heat may indicate underlying oversupply if power demand was exceptionally high.
End-of-season levels matter more than isolated weekly reports
Individual storage reports can be distorted by weather, holidays, pipeline maintenance and reporting noise.
The more important milestones are:
End-of-March inventory
End-of-October inventory
The pace of refill after winter
The rate of draw during the first sustained cold period
Regional storage constraints
A gas thesis should not be declared correct or incorrect based on one weekly injection. It should be evaluated against the full seasonal trajectory.
The supply-response audit
The demand outlook is relatively visible. Supply is where the thesis can either become valuable or fail.
Permian associated gas: the largest bearish variable
The EIA’s upward revision to its gas-production forecast is driven largely by the Permian Basin. Associated gas is produced alongside oil, meaning the decision to drill is often based primarily on oil economics rather than the natural-gas price.
This supply can continue even when local gas prices are extremely weak or negative. Producers may accept poor gas realizations because oil and natural-gas liquids generate most of the well’s economic value.
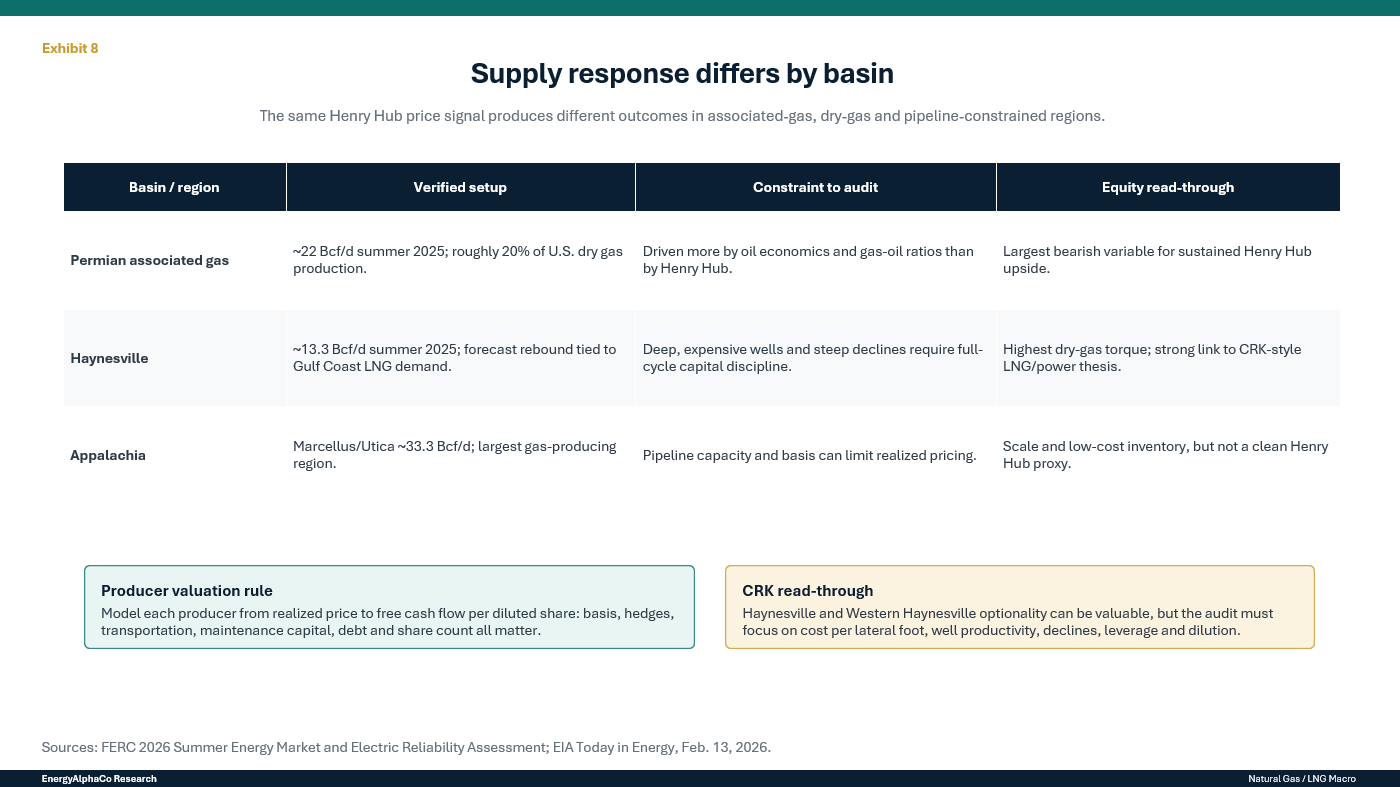
FERC estimated that the Permian produced approximately 22 Bcf/d of dry gas during summer 2025, representing roughly 20% of total U.S. production. It noted that elevated oil prices were expected to support additional oil-directed drilling and associated-gas production.
This is the single most important downside risk to a bullish gas thesis.
A scenario in which oil drilling remains strong, Permian gas takeaway expands and processing constraints ease could supply a large portion of incremental U.S. demand without requiring materially higher Henry Hub prices.
Investors should monitor:
Permian oil rig activity
Gas-oil ratios
Waha basis
New pipeline capacity
Processing and fractionation additions
Producer flaring and curtailment
Oil-price sensitivity
Haynesville: the most direct LNG supply response
The Haynesville is geographically advantaged because it is close to Gulf Coast LNG terminals and major southeastern demand centers. It is also a dry-gas basin, so drilling activity responds more directly to natural-gas economics.
FERC reported Haynesville production of approximately 13.3 Bcf/d during summer 2025, below the 2023 peak of 14.7 Bcf/d, and cited an EIA forecast for a 1.2 Bcf/d rebound in 2026 as Gulf Coast LNG demand expands.
The Haynesville can grow. The harder question is the price required to sustain that growth after accounting for:
Deep and high-pressure wells
Drilling and completion costs
Steep initial declines
Gathering and transportation
Service-cost inflation
Corporate interest expense
The capital required to replace depleted production
Large initial production rates are not equivalent to low full-cycle costs. Investors should focus on cumulative recovery, decline curves and capital efficiency rather than the first 30 or 90 days of production.
Comstock Resources is the clearest high-torque example. It is focused on the Haynesville and Western Haynesville in Louisiana and East Texas. Its Western Haynesville position is close to prospective Gulf Coast and Texas power demand, but development requires substantial capital and investors must evaluate leverage, well costs, decline rates and fully diluted per-share value—not merely resource size.
Appalachia: abundant resource, constrained market access
The Marcellus and Utica remain the largest U.S. gas-producing region. FERC estimated combined production of approximately 33.3 Bcf/d in 2025, or about 31% of U.S. dry-gas production. Growth has slowed partly because of pipeline limitations rather than resource scarcity.
This distinction is crucial.
Appalachian producers may possess some of the lowest-cost gas in the country, but low geological cost does not guarantee high realized pricing. Basis differentials, firm-transport commitments and access to premium markets can have as much influence on corporate cash flow as Henry Hub itself.
Additional pipeline capacity can unlock supply and benefit producers, but it can also weaken the national commodity thesis by allowing more low-cost gas to reach demand centers.
The equity winners are likely to be producers that combine:
Low maintenance capital
Long inventory duration
Firm transportation to attractive markets
Strong balance sheets
Disciplined growth
Limited dilution
The market does not need $6 gas for equities to work
Natural-gas equities can generate strong returns without a persistent shortage.
The move from a $2.50 environment to a $3.75 environment can materially expand margins because many corporate costs do not increase proportionally with commodity prices. The resulting free cash flow can reduce net debt, fund buybacks or support dividends.
However, the relationship is not linear.
A nominal $1/MMBtu increase in Henry Hub does not translate into $1/MMBtu of incremental corporate cash flow. The benefit is reduced by:
Basis differentials
Gathering and transportation
Hedging losses
Royalties and production taxes
Higher service costs
Additional drilling required to grow
Cash interest and taxes
Dilution
The correct question is not, “How much does the stock rise if gas reaches $5?”
It is:
How much fully diluted free cash flow per share does the company produce at $3, $4 and $5 gas after realistic basis, hedges, maintenance capital and financing costs?
That calculation will be the foundation of EnergyAlphaCo’s company-level gas-producer work.
EnergyAlphaCo natural-gas scenarios
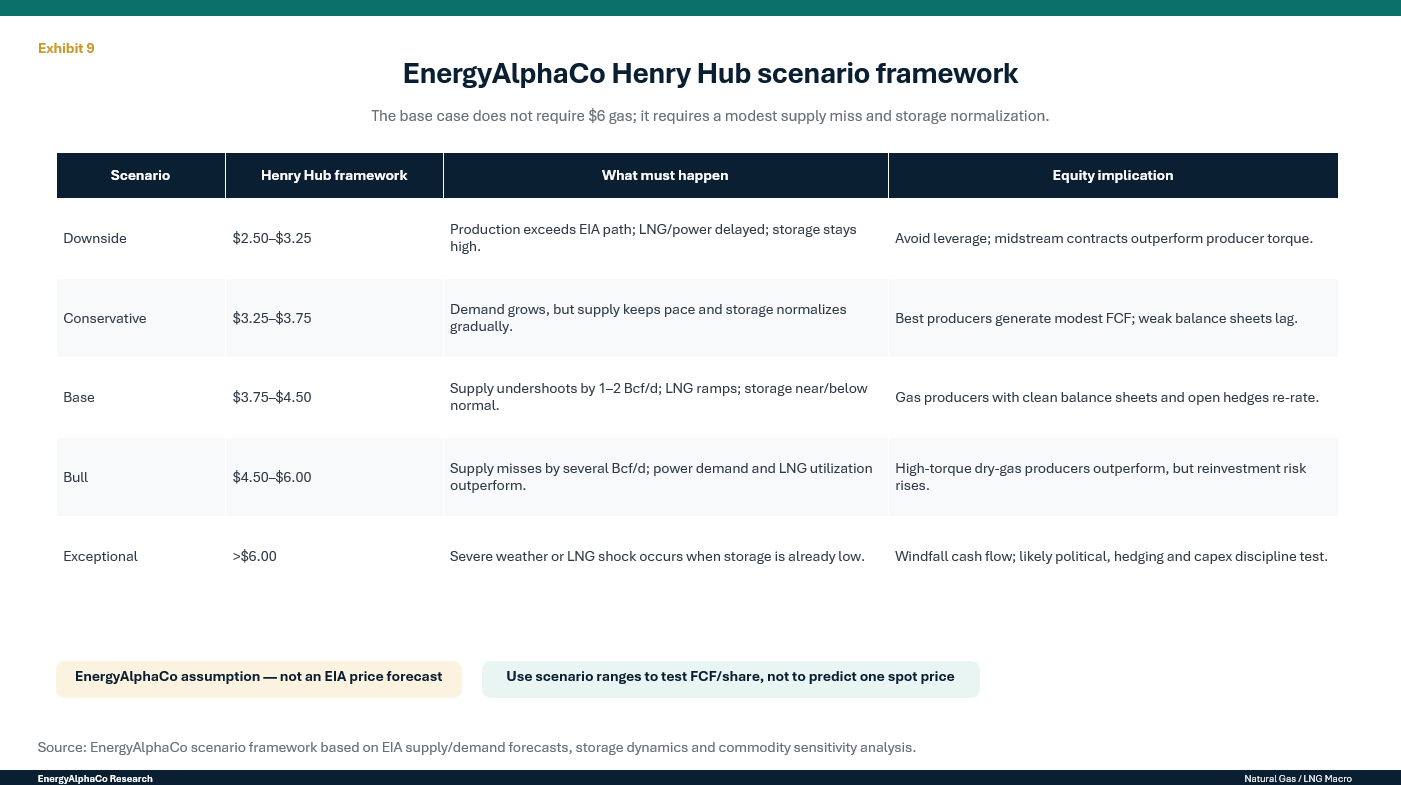
These ranges are analytical assumptions, not point-price predictions.
Scenario
Henry Hub framework
Required conditions
Downside
$2.50–$3.25/MMBtu
Dry-gas production reaches or exceeds the EIA forecast; Permian associated gas remains strong; LNG projects ramp slowly; power demand disappoints; storage stays materially above normal.
Conservative
$3.25–$3.75/MMBtu
Demand grows broadly as expected, but production keeps pace; storage gradually normalizes without becoming tight; weather is moderate.
Base
$3.75–$4.50/MMBtu
Production undershoots the EIA forecast by approximately 1–2 Bcf/d; LNG facilities ramp largely on schedule; power demand remains firm; storage moves close to or modestly below normal.
Bull
$4.50–$6.00/MMBtu
Supply misses by several Bcf/d; data-center and power projects convert into actual load; LNG utilization remains high; storage falls materially below normal.
Exceptional tightening
Above $6.00/MMBtu
A cold winter, hot summer, freeze-off, pipeline disruption or global LNG shock occurs when domestic storage is already low.
The current EIA forecast belongs near the conservative case, while the futures market prices significant winter seasonality but not a sustained bull regime.
The base EnergyAlphaCo thesis does not require exceptional tightening. It requires only that the supply response prove modestly less perfect than the official forecast.
Equity implications
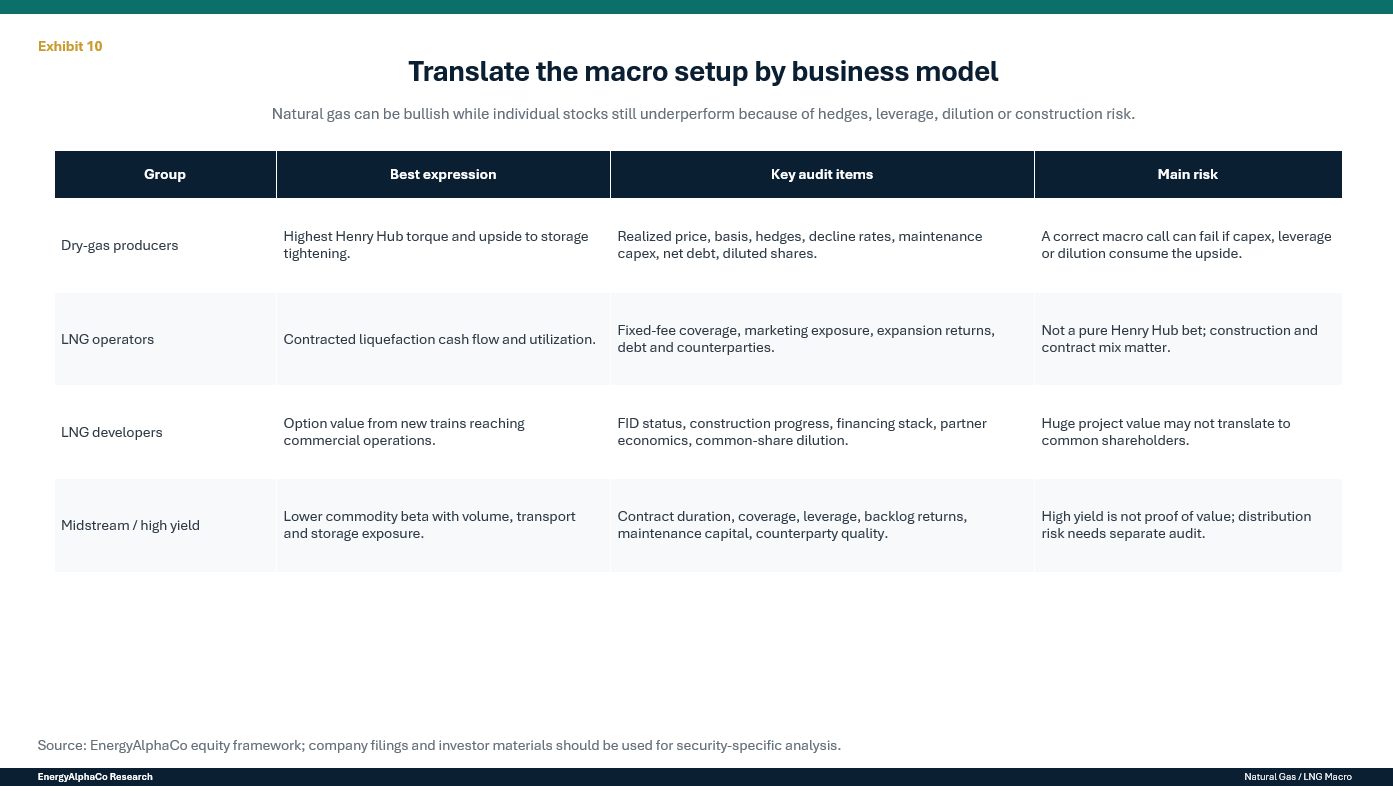
1. Gas producers: highest upside, highest forecasting risk
Gas producers offer the most direct upside if Henry Hub and regional realizations improve. They also carry the greatest exposure to weather, well performance, inflation, hedging and capital-allocation mistakes.
Comstock Resources
Comstock provides substantial dry-gas torque through the Haynesville and Western Haynesville. Its location offers proximity to Gulf Coast LNG and prospective Texas power demand. Recent Western Haynesville wells have produced strong initial rates, supporting the resource case.
The investment case cannot rest on acreage size or initial production rates alone. Comstock must demonstrate that the Western Haynesville can deliver competitive full-cycle returns after drilling costs, infrastructure spending, declines and financing costs.
What strengthens the case:
Sustained well productivity across a larger sample
Lower drilling and completion cost per lateral foot
Improved free cash flow at $3.50–$4 gas
Debt reduction
Firm access to power and LNG demand
Limited equity dilution
What weakens the case:
Capital spending repeatedly exceeds operating cash flow
Production growth requires persistently high reinvestment
Western Haynesville declines or costs disappoint
Associated gas prevents Henry Hub from sustaining the assumed range
EQT
EQT offers scale, low-cost Appalachian inventory and an integrated midstream position. First-quarter 2026 sales volume reached 618 Bcfe, while management cited strong well performance and infrastructure optimization.
Its advantages include inventory depth and the ability to optimize production and transportation across a large system. The principal macro risk is that Appalachian basis and pipeline constraints prevent the company from fully capturing Henry Hub strength.
EQT is likely to offer less pure commodity torque than a highly leveraged dry-gas producer but greater resilience if prices remain moderate.
Range Resources
Range combines Appalachian gas with meaningful NGL exposure and a transportation portfolio that can reach premium markets. The company’s own multiyear outlook uses a $3.75 NYMEX gas assumption, illustrating that substantial free cash flow does not necessarily require a $5–$6 commodity environment.
NGL exposure provides diversification but also means the stock is not a pure Henry Hub instrument. Investors must model natural gas, ethane, propane and other liquids separately.
Antero Resources
Antero’s marketing, transportation and liquids exposure can create differentiated realizations, particularly when export and Gulf Coast markets are strong. The same complexity makes simple Henry Hub sensitivity less informative.
The company should be evaluated on realized pricing by product, transportation commitments, liquids margins, hedge positions and leverage rather than on headline gas production alone.
Producer conclusion
The gas-producer ranking should not be based solely on which company has the most reserves or the highest production growth.
EnergyAlphaCo will rank producers using:
Free-cash-flow sensitivity
Maintenance capital
Basis and transportation
Hedge exposure
Net debt
Inventory duration
Decline rates
Fully diluted share count
Management incentives
Per-share capital allocation
2. LNG-linked equities: separate operators from developers
LNG-linked stocks are often treated as direct bets on global LNG prices. That is frequently incorrect.
Cheniere Energy
Cheniere’s business is supported substantially by long-term contracts with fixed-fee components. Its integrated production-marketing agreements are designed to generate stable margins between gas purchases and LNG sales, although accounting marks can produce substantial reported volatility.
Cheniere therefore offers a different exposure from a gas producer:
More contractual cash-flow visibility
Less direct upside from a simple increase in Henry Hub
Exposure to terminal utilization and optimization
Capital-allocation and expansion opportunities
Construction and counterparty risk
Higher U.S. gas prices can increase feedstock costs, but many contracts pass the Henry Hub component through to the buyer. The more relevant questions are contract coverage, fixed fees, uncontracted capacity, expansion returns and consolidated leverage.
Greenfield and expansion developers
Developers such as NextDecade can offer greater percentage upside if trains are completed, contracted and financed successfully. They also carry materially greater risks:
Construction delays
Cost overruns
Financing requirements
Joint-venture economics
Regulatory and legal challenges
Common-equity dilution
Timing gaps between capital spending and cash generation
NextDecade’s Rio Grande project provides a useful example. Trains 1 through 5 are under construction, but shareholders do not necessarily own 100% of each train’s economics, and the timing of cash distributions depends on project financing and partner-return structures.
For developers, investors must calculate the value attributable to common shareholders after project debt, partner interests, preferred claims and future equity requirements.
LNG equity conclusion
The LNG macro can be bullish while an individual LNG stock performs poorly.
A strong project with excessive construction costs or unfavorable financing may destroy per-share value. Conversely, an established operator with contracted fees can produce durable cash flow even if global LNG prices normalize.
3. Midstream and high-yield names: lower commodity beta, but not risk-free
Midstream companies can benefit from the gas buildout through additional pipeline, gathering, compression, processing and storage demand.
The attraction is contractual cash flow. The risk is that investors overpay for growth projects, assume volumes that never materialize or ignore leverage and distribution obligations.
Kinder Morgan illustrates the opportunity. At the end of the first quarter of 2026, natural-gas projects represented approximately 92% of its $10.1 billion backlog, and nearly 60% of the backlog was connected to power-generation and local-distribution-company demand. Its five largest gas pipeline systems operated at 90% average utilization in 2025, up from 74% in 2016.
This suggests that infrastructure demand is not purely speculative. Customers are committing capital to transportation and storage.
The appropriate valuation questions are:
What percentage of project capacity is supported by firm contracts?
Who are the counterparties?
Are returns protected against construction-cost inflation?
How much capital must the company contribute?
When does EBITDA begin?
Is the distribution covered after maintenance capital?
Does leverage rise before cash flow arrives?
High yield requires a separate audit
A large distribution yield is not evidence that a security is undervalued.
High-yield energy names can belong to very different business models:
Pipeline and processing partnerships
Upstream producers
Mineral and royalty companies
LNG shipping companies
Canadian gas producers
Crude-oil infrastructure
Their exposure to the gas thesis varies substantially.
Flex LNG, for example, is primarily an LNG-shipping and charter-coverage story rather than a direct Henry Hub investment. The company reported a minimum contract backlog of 55 years after a March 2026 charter announcement. That provides earnings visibility, but dividend durability still depends on charterer credit, vessel availability, refinancing, interest costs and the eventual rechartering market.
Mineral and royalty companies such as Black Stone Minerals and Kimbell Royalty Partners avoid much of the drilling capital burden because operators fund development. Their distributions remain exposed to commodity prices, operator activity, natural declines, acquisition financing and unit issuance.
Upstream yield vehicles may produce high cash distributions during favorable commodity periods, but those distributions must be tested after maintenance capital and decline replacement.
Plains All American is primarily a crude-oil and NGL infrastructure exposure. It may be an attractive income security, but it is not a clean expression of a bullish U.S. dry-gas thesis.
The EnergyAlphaCo yield audit will therefore focus on:
Distributable cash flow after maintenance capital
Distribution coverage
Net leverage
Debt maturities
Contract duration
Counterparty quality
Volume sensitivity
Commodity sensitivity
Equity issuance
Reinvestment requirements
What must be true for the constructive thesis to work
The EnergyAlphaCo base case requires several conditions:
LNG exports rise broadly in line with projects already operating or under advanced construction.
Power-sector gas consumption increases as electricity demand grows.
Data-center demand converts from announcements into operating load, although at a materially discounted rate relative to gross queues.
U.S. dry-gas production grows, but undershoots the EIA’s 115.3 Bcf/d 2027 forecast by approximately 1–2 Bcf/d.
Storage moves from an above-normal position toward normal or modestly below normal.
Producers maintain enough capital discipline that higher prices generate free cash flow rather than another oversupply cycle.
Pipeline additions do not unlock enough low-cost gas to overwhelm incremental demand immediately.
Equity investors select companies that retain the commodity upside after basis, hedges, leverage and dilution.
None of these assumptions is extreme. Their interaction, rather than any single forecast, drives the thesis.
Thesis breakers
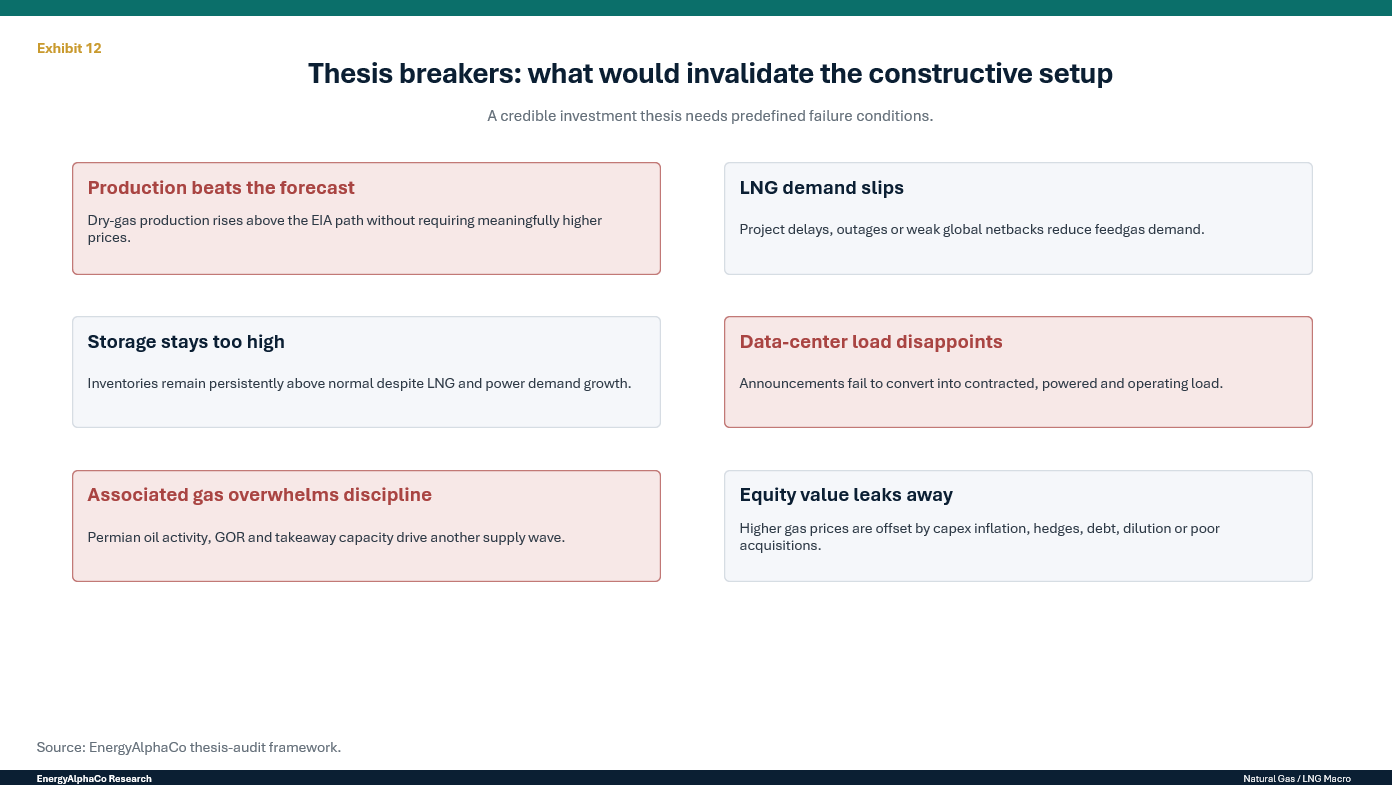
The constructive U.S. gas thesis would be materially weakened or invalidated by the following developments:
1. Production materially exceeds the EIA forecast
If dry-gas production rises above 115 Bcf/d while Henry Hub remains below approximately $3.50, the market’s productive capacity would be stronger and cheaper than the base thesis assumes.
2. Storage remains persistently above normal
If storage surpluses remain above 5% despite LNG and power-demand growth, incremental supply is clearly outpacing the structural demand additions.
3. Associated gas overwhelms dry-gas discipline
A sustained increase in Permian oil drilling, gas-oil ratios and takeaway capacity could create supply largely insensitive to Henry Hub.
4. LNG projects are delayed or underutilized
Construction delays, terminal outages, weak global demand or reduced international price spreads could push expected feedgas demand into later years.
5. Data-center load is substantially overstated
Cancellations, grid constraints, efficiency gains, slower artificial-intelligence investment or alternative generation could reduce the expected power-demand step-up.
6. Pipeline expansion unlocks a larger low-cost supply response
New transportation from Appalachia, the Permian or Western Canada could meet demand without a sustained increase in Henry Hub.
7. Producers abandon capital discipline
A rapid increase in rigs, completion crews and corporate growth targets could recreate the oversupply conditions that have repeatedly damaged gas investors.
8. Higher prices fail to produce per-share value
The commodity thesis can be correct while the equity thesis fails because of high leverage, equity issuance, poor acquisitions, hedging losses or excessive reinvestment.
Final assessment
The U.S. natural-gas market is not yet structurally short. It is becoming structurally less forgiving.
LNG exports, power generation and industrial demand are increasing the amount of gas that must be produced and transported. Storage remains comfortable enough to limit near-term price pressure, while the EIA expects record Permian and Haynesville production to keep the market balanced through 2027.
That official outlook may prove correct. It also leaves little room for error.
A production miss of 1–2 Bcf/d would be small relative to total U.S. output but large relative to the current storage surplus. The same is true of stronger power demand, faster LNG commissioning or unusual weather. As storage normalizes, the price consequences of those deviations become larger.
The most attractive equity setup is therefore not a blind bet on permanently high gas prices. It is selective exposure to companies that can create meaningful free cash flow in a moderate $3.75–$4.50 environment, survive another period below $3 and retain substantial upside if the balance tightens.
Dry-gas producers offer the greatest commodity torque but require the most careful audit of declines, capital intensity, basis, leverage and hedges. LNG operators offer more contractual visibility but less direct Henry Hub upside. Developers can create substantial value but introduce construction, financing and dilution risks. Midstream and high-yield names can provide more stable cash flow, but distributions must be tested against maintenance capital, leverage and contract quality.
The central EnergyAlphaCo conclusion is straightforward:
LNG and power demand make the U.S. gas market more investable, but storage and supply determine when that structural story becomes a commodity-price story. Company-level returns will depend on who converts that price environment into durable, fully diluted free cash flow per share.