
THE THESIS AUDIT: Crescent Energy: The Per-Share Test Behind the Acquisition Machine
Can operational execution, free cash flow and deleveraging outrun commodity risk, acquisition appetite and dilution?




EnergyAlphaCo Research
Informational and educational purposes only. See the disclosure at the end of this report.
Investment conclusion
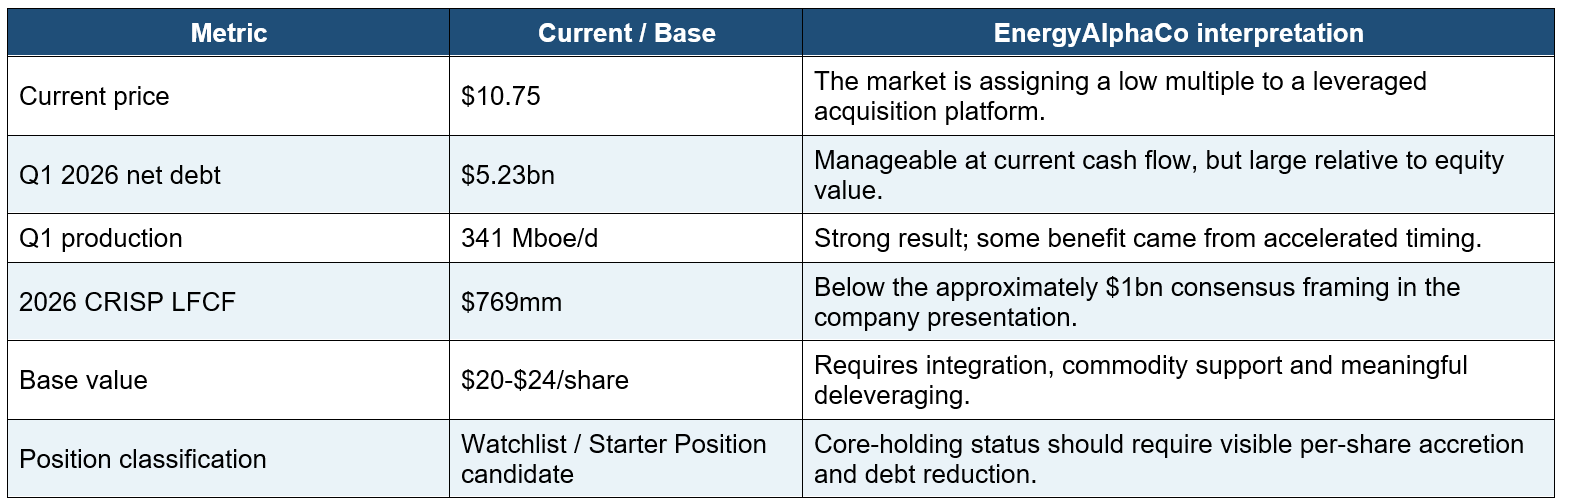
Crescent Energy presents a credible but not yet fully proven rerating opportunity. The company has assembled a large, liquids-weighted portfolio across the Eagle Ford, Permian and Uinta basins, reported strong first-quarter production, refinanced expensive near-term debt and outlined meaningful operating efficiencies. At $10.75 per share, the market values the company at approximately $3.55 billion of equity and $8.78 billion of enterprise value, or about 2.8 times the company-reported last-twelve-month Adjusted EBITDAX measure. That valuation embeds substantial skepticism. [1][2]
The skepticism is reasonable. Crescent has more than $5.2 billion of net debt, an acquisition strategy that has repeatedly expanded both the asset base and the share count, material oil and natural-gas hedges, an externally managed structure, and a convertible security that can add dilution if the share price rises. The investment case therefore cannot be judged by production growth, Adjusted EBITDAX or headline free cash flow alone. It must be judged by the growth in free cash flow per fully diluted share after acquisition costs, recurring capital, interest, dividends, equity compensation and conversion risk.
EnergyAlphaCo’s CRISP (Commodity-Responsive Investment Scenario Platform - our EnergyAlphaCo’s proprietary financial-modeling framework) base case assumes $76 WTI and $3.70 Henry Hub in 2026, approximately 332 Mboe/d of production, $1.375 billion of development capital and a negative $330 million cash hedge effect. It produces approximately $769 million of 2026 levered free cash flow and year-end net debt of roughly $4.62 billion, assuming no material acquisition after the first-quarter minerals transactions. For 2027, the base case produces approximately $978 million of levered free cash flow and $3.91 billion of ending net debt. These are EnergyAlphaCo estimates, not company guidance.
Our EV/EBITDAX scenario produces a base value of $21.59 per fully diluted share, while the levered-free-cash-flow DCF produces $22.65. We therefore use a base valuation range of $20 to $24. The conservative scenario falls to approximately $6 to $9, and the $50 WTI downside case can eliminate most or all modeled equity value because debt sits ahead of the common stock. The bull and exceptional-execution cases reach approximately $36 and $54, respectively, but require stronger commodity prices, sustained production, lower unit costs, rapid deleveraging and disciplined capital allocation.
The company in one paragraph
Crescent Energy is a U.S. exploration-and-production company built around a returns-driven acquisition strategy. The portfolio now includes substantial Eagle Ford, Permian and Uinta operating positions plus a minerals and royalties business. First-quarter 2026 production averaged 341 Mboe/d, including 140 Mbbl/d of oil, and was 64% liquids. The Vital Energy merger closed in December 2025 and added the Permian as a third core operating area. Crescent also acquired approximately $358 million of Eagle Ford mineral and royalty interests during the first quarter of 2026. [1][2]
Why the opportunity may exist
Crescent combines several characteristics that public markets often discount: a complicated acquisition history, relatively high absolute debt, external management, a large hedge book, a recent transformative transaction and a share count that has changed materially. Investors who screen on GAAP earnings also see a $419 million first-quarter net loss, even though that loss was dominated by derivative marks. Investors who focus only on headline free cash flow may reach the opposite error and ignore acquisition spending, debt, dilution and the capital needed to sustain production.
The market may also be waiting for proof that the operational claims translate into cash. Crescent reported first-quarter production roughly 4% above the midpoint of annual guidance and said the Permian program was approximately 100 producing days ahead of the prior operator’s plan. Management also said $120 million of Permian synergies had been captured. Those statements are encouraging, but “captured” is not yet a complete cash-flow reconciliation. The market is entitled to demand lower unit costs, higher cash margins and falling debt before awarding a better multiple. [2]
At the current price, investors are effectively being paid to test whether the company can become simpler, less leveraged and more per-share focused. The stock does not require an exceptional multiple to work. It does require the company to resist the temptation to recycle every dollar of free cash flow into the next acquisition before the benefits of the last one become visible.
The original bull case
The outside bull case has four parts. First, Crescent acquires assets from owners that are less focused, less efficient or financially constrained. Second, its operating team applies a repeatable playbook: right-size activity, re-bid services, increase pad and lateral efficiency, improve completion cadence and optimize infrastructure. Third, higher production and lower unit costs expand free cash flow. Fourth, debt reduction, dividends and selective repurchases cause the equity to rerate.
Some research groups applies this logic and reaches a $27.50 fair-value estimate. That target is directionally consistent with the upper end of EnergyAlphaCo’s DCF range, but the profile does not provide a sufficiently complete bridge through commodity prices, debt, fully diluted shares and the convertible to use the target as evidence.
Other articles we read argue that the backing of KKR and John Goff, continued cost improvements and an eventual sale of the company justify a much higher valuation. It suggests the stock could be worth roughly 15 times current cash flow per share. EnergyAlphaCo does not use that methodology. A capital-intensive E&P company should not be valued on an unexplained cash-flow multiple that ignores the commodity cycle, sustaining capital, leverage and dilution. The article’s suggestions that the company has “low debt,” that cost improvement almost guarantees better results, or that expansion into refining, midstream or chemicals would reduce risk are interpretations or speculation, not verified facts.
The Thesis Audit
1. The operating footprint has scale and flexibility
The asset base is large enough to allocate capital among multiple basins. Crescent reported 170 Mboe/d of first-quarter Eagle Ford production, 133 Mboe/d in the Permian and 23 Mboe/d in the Uinta. The minerals business contributed 11 Mboe/d during the quarter, with only a partial contribution from the 2026 acquisitions. Management describes the minerals portfolio as a roughly 12 Mboe/d run-rate business capable of approximately $200 million of EBITDA at the then-current strip without Crescent funding the operators’ development capital.
Diversification is useful, but it does not eliminate commodity exposure. The portfolio remains primarily an upstream cash-flow stream. Oil drives most revenue, natural gas realizations are affected by regional basis, and the minerals business depends on third-party drilling decisions. Basin diversification improves capital optionality; it does not make the equity defensive.
2. Q1 outperformance was real, but timing and durability matter
First-quarter production of 341 Mboe/d exceeded the midpoint of the 320-335 Mboe/d annual guidance range by approximately 4%. Oil production of 140 Mbbl/d also exceeded the guidance midpoint. Crescent incurred approximately $385 million of accrued development capital during the quarter. The company attributed the result to faster cycle times, base-production performance and the acceleration of Permian wells. [1][2]
The distinction between accelerated production and improved well economics is important. Bringing wells online earlier increases current production and free cash flow, but it can move volumes from a later quarter rather than increase full-cycle recovery. The next test is whether full-year production stays near or above guidance without an upward revision to capital. Investors should also compare well results and base decline, not only the timing of first production.
3. The efficiency metrics are promising
In the Eagle Ford, management reported simulfrac utilization rising from approximately 20% of gross wells in the 2023 program to approximately 85% in 2026 year-to-date, completion efficiency improving from roughly 1,700 to 2,400 lateral feet per day and pumping efficiency rising from approximately 82,000 to 112,000 fluid barrels per day. In the Permian, Crescent cited approximately $25 per foot of service savings, approximately $300,000 of infrastructure savings per well and 100,000 additional lateral feet in the 2026 plan. The Uinta program was reported at approximately $800 of drilling, completion and facilities cost per foot, about 20% below the 2022-2025 historical average. [2]
These metrics support the operating thesis, but speed is not the same as return. The audit should focus on total completed-well cost, production and decline per dollar invested, workover expense, gathering and transportation expense, and the cash cost of sustaining the combined production base. First-quarter workover expense increased materially year over year because of the Vital assets. [1]
4. Free cash flow is meaningful, but the definition needs discipline
Crescent reported $409 million of first-quarter operating cash flow and $192 million of levered free cash flow. The company’s non-GAAP measure excludes acquisitions, which is appropriate for evaluating the cash generation of the operating asset base but incomplete for evaluating the acquisition strategy. Crescent spent approximately $352 million of cash on oil and gas property acquisitions in the quarter, principally the minerals transactions. Cash available for debt reduction therefore depends on both operating free cash flow and management’s willingness to stop redeploying it. [1]
The first-quarter cash-flow statement also included a $142 million use of working capital. Investors should avoid annualizing one quarter mechanically. EnergyAlphaCo’s 2026 CRISP estimate of $769 million is below the approximately $1 billion consensus figure presented by the company because our case gives explicit weight to hedge losses, normalized commodity pricing and full-year interest and capital. [2][5]
5. The hedge book protects the downside and taxes the upside
Crescent realized approximately $100 million of negative cash commodity-derivative settlements during the first quarter and another $5.5 million of derivative settlement related to contingent consideration. The company also recorded approximately $601 million of unrealized derivative losses, which were the largest reason GAAP earnings were negative. The unrealized mark is non-cash; the cash settlements reduce free cash flow. [1]
At March 31, Crescent had 16.454 million barrels of 2026 WTI swaps at an average price of $64.57, plus collars and three-way collars. It also had 2027 oil swaps, extendible swaps and collars. Natural-gas hedges include Henry Hub swaps, collars, Waha fixed-index swaps and basis swaps. This provides useful protection in the conservative and downside cases, but it means high spot prices do not flow fully into realized cash margins. The three-way collars also provide incomplete protection below the short-put strike.
6. Acquisition execution is the central per-share test
The Vital merger issued approximately 73.3 million Crescent shares and brought approximately $2.49 billion of long-term debt onto the acquired balance sheet. The Ridgemar acquisition used approximately $807 million of cash and 5.5 million shares and can require up to $170 million of contingent payments. The 2026 minerals acquisitions used approximately $358 million of cash. These transactions may create value, but the proper denominator is not production, acreage or Adjusted EBITDAX. It is fully diluted shares plus net debt and contingent obligations. [1]
The first Ridgemar contingent payment illustrates the point. The average first-quarter 2026 WTI price of $71.93 triggered a $15 million payment in April. Higher oil prices help operating cash flow but can also increase acquisition consideration and hedge losses. A complete model must capture all three effects.
7. Governance and dilution deserve a persistent discount until proven otherwise
Crescent is externally managed and the Q1 filing states that recurring G&A increased partly because Manager Compensation rose following the Vital merger. A KKR affiliate also holds non-economic Series I preferred stock that provides board-appointment and other approval rights. These arrangements may align the company with a sophisticated sponsor, but they also create governance complexity that a conventional internally managed E&P does not have. [1]
Basic shares outstanding were approximately 330.3 million at April 30, 2026. The Vital and Ridgemar transactions demonstrate that acquisition dilution is not theoretical. Crescent also issued $690 million of 2.75% convertible notes due 2031 with an initial conversion price of approximately $14.89. The company purchased capped calls with an initial cap of $22.48, but actual settlement mechanics can differ from a simple share-count calculation. EnergyAlphaCo uses a conservative gross-conversion treatment in the base and higher valuation scenarios and gives no value to the capped call. [1]
Operating and financial model
The CRISP base forecast is designed to answer a simple question: what cash flow and deleveraging can the existing portfolio produce without relying on another acquisition? It is not a prediction of exact commodity prices. It is a transparent set of assumptions that can be updated each quarter.
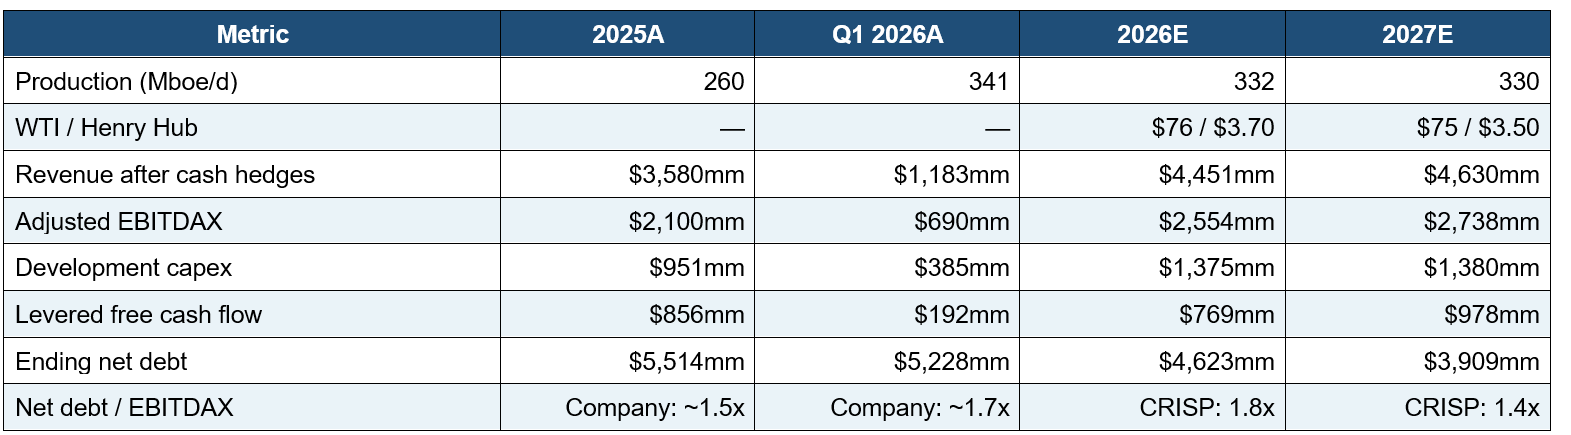
The 2026 forecast assumes an average realized oil price of approximately $72.96 per barrel before cash hedge settlements and an average realized gas price of approximately $2.22 per Mcf. It assumes adjusted operating expense of $11.90 per Boe, cash G&A of $1.20 per Boe, approximately $380 million of cash interest and no cash taxes. The model produces approximately $2.25 of levered free cash flow per fully diluted share before gross convertible dilution.
The net-debt trajectory is the most decision-useful output. Under the base case, retained free cash flow after the fixed dividend reduces net debt to roughly $4.62 billion by year-end 2026 and $3.91 billion by year-end 2027. The model assumes $100 million of 2027 buybacks, but the investment thesis does not require repurchases to work. It requires management to avoid a large new acquisition that consumes the deleveraging capacity.
Commodity sensitivity
Crescent’s oil weighting creates substantial operating leverage. The debt load creates additional equity leverage. The hedges moderate the first effect in the near term but do not remove the second. At $50 WTI and $2.50 Henry Hub, CRISP estimates approximately $1.21 billion of Adjusted EBITDAX and negative $357 million of levered free cash flow despite an estimated positive $250 million hedge contribution. Ending net debt rises to nearly $6.0 billion, and the equity has little modeled value under a 3.0 times multiple.
At $60 WTI and $3.00 Henry Hub, the conservative case produces approximately $1.81 billion of Adjusted EBITDAX and $128 million of levered free cash flow. The dividend largely consumes that cash and leverage remains approximately 2.8 times. The current share price is therefore not a pure bargain independent of commodity prices. It is a claim on management execution with a meaningful oil-price floor requirement.
The base, bull and exceptional cases show the opposite effect. Stronger prices expand cash flow, reduce debt and justify a better multiple. The valuation rises nonlinearly because both the numerator and the balance sheet improve. This is why any target above $30 should be presented as a conditional outcome, not a conventional twelve-month price target.
Balance sheet and dilution
Long-term debt was approximately $5.238 billion at March 31, with only $9.8 million of unrestricted cash. The March refinancing replaced $500 million of 9.25% notes due 2028 with the 2.75% convertible due 2031, extending maturity and reducing cash interest. Crescent also repurchased approximately $40 million of 7.75% notes due 2029. The weighted-average interest expense fell from approximately 7.67% to 7.13%. This was a sensible refinancing, but it exchanged expensive debt for a security that can dilute the equity if the stock performs. [1][2]
EnergyAlphaCo’s fully diluted framework begins with 330.3 million basic shares, adds 12 million estimated employee and manager awards in the base case, and adds 46.3 million gross convertible shares when the preliminary valuation exceeds $14.89. The base scenario therefore uses approximately 388.6 million shares. The estimate is intentionally conservative and the actual diluted count may be lower because of settlement elections and the capped call. It may also be higher if future acquisitions or performance awards add more shares.

Valuation scenarios
EnergyAlphaCo uses multiple methods because no single E&P multiple captures commodity exposure, leverage, reserve value, hedge effects and dilution. The scenario model applies EV/EBITDAX multiples from 3.0 times to 5.25 times to normalized 2027 results, then subtracts scenario net debt and adjusts for estimated awards and gross convertible dilution. The DCF discounts levered free cash flow at a 12% cost of equity with a 1% terminal growth rate.

The scenario point values should be read as centers of ranges, not precise targets. EnergyAlphaCo uses approximately $0-$3 for the downside, $6-$9 for the conservative case, $20-$24 for the base case, $32-$40 for the bull case and $45-$60 for exceptional execution.
The DCF produces approximately $22.65 per share, close to the EV/EBITDAX base case. That agreement is useful but not independent proof because both methods rely on the same operating assumptions. A reserve-value cross-check is more conservative: the company disclosed $7.5 billion of proved-developed PV-10 and $8.6 billion of total proved PV-10 at year-end 2025 SEC pricing of $65.34 oil and $3.39 gas. Subtracting current net debt produces a rough pre-corporate equity reference of approximately $7-$10 per basic share. That is not a formal NAV because PV-10 is pre-tax, reserve estimates can change, corporate costs and hedges matter, and the total proved figure includes future development capital. It does, however, help explain why the conservative case is well below the base case. [2]
What must be true
Permian integration savings must appear in reported unit costs and cash flow, not only in activity metrics or annualized synergy claims.
Total production must remain near the 320-335 Mboe/d guidance range without development capital moving materially above $1.425 billion.
Net debt must decline sequentially after dividends and before giving credit to an investment-grade objective.
Free cash flow per fully diluted share must rise after stock compensation, manager awards and the convertible are considered.
The minerals portfolio must deliver high-margin cash flow without a material slowdown in third-party activity.
Future acquisitions must be financed and priced so that value per diluted share rises under conservative commodity assumptions.
The hedge book must roll off without being replaced at prices that permanently cap the upside required to deleverage.
What investors should monitor
Thesis breakers
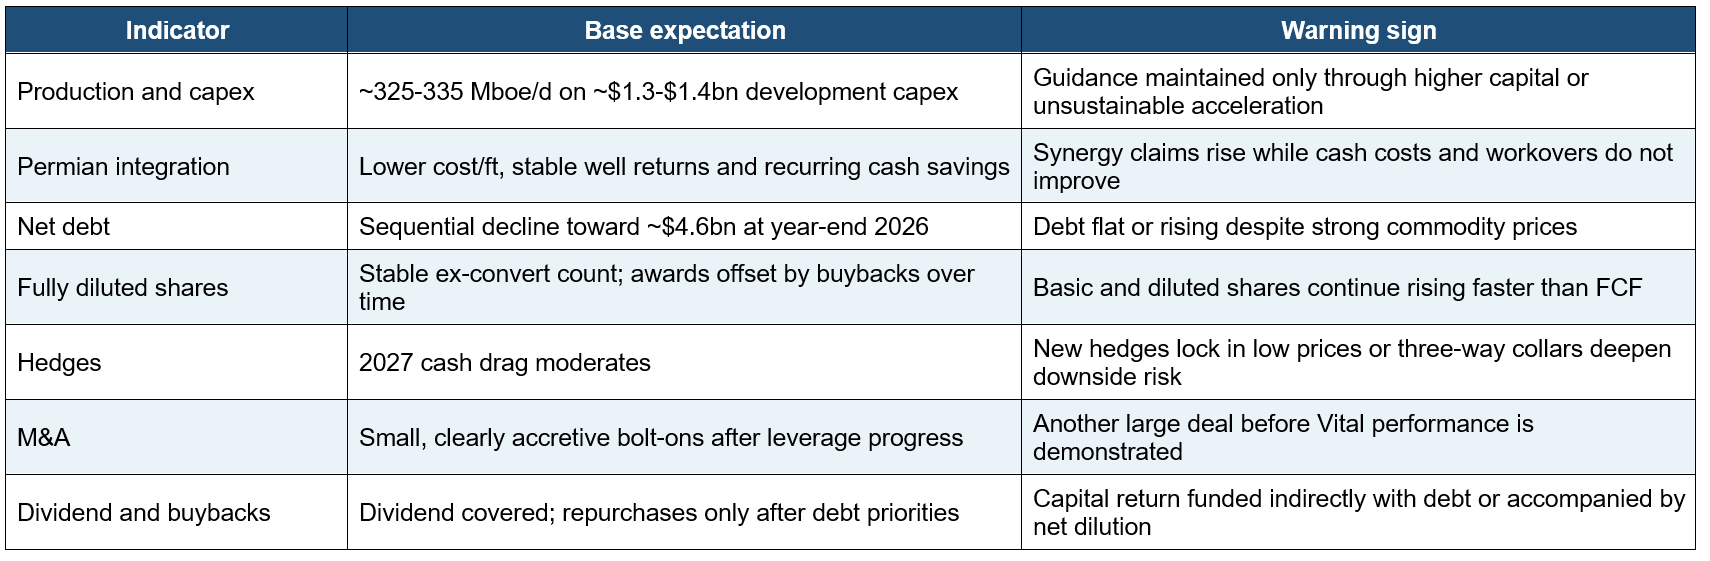
· Net debt does not decline during a commodity environment that should generate free cash flow well above the fixed dividend.
· Crescent announces another large acquisition before the Vital integration, base decline and leverage targets are demonstrated.
· Sustaining production requires capital materially above the current framework or production falls below approximately 315 Mboe/d without an offsetting increase in per-share free cash flow.
· The $120 million Permian synergy claim cannot be reconciled to lower costs, higher margins or cash savings.
· Cash hedge settlements, contingent acquisition payments and interest consume enough cash to prevent deleveraging.
· Employee, manager, acquisition or convertible dilution materially exceeds the model allowance.
· The external-management and governance structure results in related-party economics or capital-allocation decisions that do not maximize common-stock value.
Final assessment
Crescent Energy is not a simple low-multiple oil stock. It is an acquisition platform whose equity value depends on the interaction of operating execution, commodity prices, debt, hedges and dilution. The first-quarter evidence is favorable: production was strong, operational efficiency improved, the Permian integration was ahead of plan and the refinancing lowered the cost of capital. The evidence is not yet complete: absolute debt remains high, cash hedge settlements were negative, the share count has expanded materially and management continues to describe M&A as a use of free cash flow.
The stock is attractive at the current price because the market does not require perfection. EnergyAlphaCo’s base case produces approximately double the current price, and the DCF reaches a similar value. The conservative case, however, is below the current price, and the downside case demonstrates that the debt can absorb most of the asset value under weak commodities. The risk-reward is therefore asymmetric, but not low risk.
EnergyAlphaCo classifies CRGY as a Watchlist / Starter Position candidate. A more confident Core Holding classification should require three pieces of evidence: a visible reduction in net debt, stable fully diluted shares, and proof that the Permian synergy and efficiency claims are converting into recurring free cash flow per share. Until those conditions are met, the correct thesis is not “Crescent is cheap.” It is “Crescent can become much more valuable if the acquisition machine finally demonstrates that enterprise growth is creating common-share value.”
Sources and classification notes
[1] Crescent Energy Company, Form 10-Q for the quarter ended March 31, 2026. SEC filing: https://www.sec.gov/Archives/edgar/data/1866175/000186617526000090/crgy-20260331.htm
[2] Crescent Energy, Q1 2026 Earnings Presentation, May 2026. Uploaded company presentation; investor-relations homepage: https://ir.crescentenergyco.com/
[3] Crescent Energy, 2025 Form 10-K. SEC filing: https://www.sec.gov/Archives/edgar/data/1866175/000186617526000026/crgy-20251231.htm
[4] U.S. Energy Information Administration, Short-Term Energy Outlook, July 2026: https://www.eia.gov/outlooks/steo/
[5] EnergyAlphaCo CRISP Institutional Model v1.0 — CRGY, July 17, 2026. All CRISP outputs are EnergyAlphaCo estimates, not verified facts or company guidance.
Investment-risk disclosure
This material is for informational and educational purposes only and does not constitute individualized investment advice, an offer to buy or sell securities, or a recommendation suitable for any particular investor. Energy and commodity equities can be highly volatile and may be affected by commodity prices, operational performance, reserve estimates, leverage, hedging, acquisitions, capital-market access, regulation, litigation, geopolitical events and other risks. Forecasts, valuation scenarios and CRISP outputs are estimates based on stated assumptions and can be materially wrong. Readers should perform their own due diligence and consider their financial circumstances and risk tolerance. The author may discuss securities in which the author has a financial interest; any applicable ownership position should be disclosed at publication.