
The Energy Scorecard: Natural Gas & LNG
Global LNG Tightens, but U.S. Gas Remains Well Supplied

Week ended July 17, 2026
EnergyAlphaCo’s weekly scorecard tracks the market and operating indicators that determine whether the U.S. natural-gas investment thesis is strengthening, weakening or merely being delayed.
Executive assessment
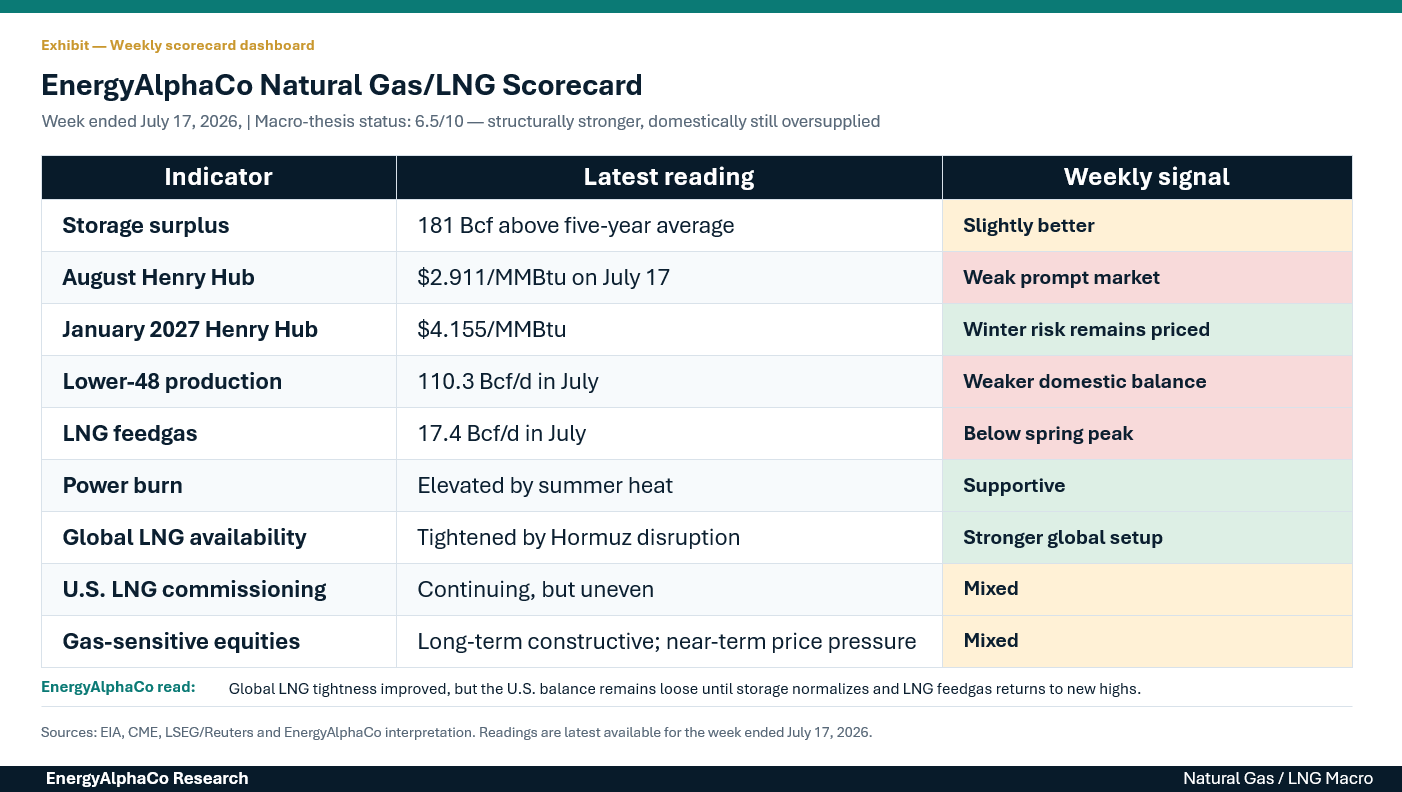
EnergyAlphaCo macro-thesis rating: 6.5/10 — structurally stronger, domestically still oversupplied
The most important development this week was the growing divergence between the global LNG market and the domestic U.S. natural-gas market.
Global LNG availability tightened as shipping through the Strait of Hormuz slowed sharply. No LNG tankers crossed the strait for several days, while loaded Qatari cargoes accumulated as floating storage. That disruption strengthens the strategic value of existing U.S. LNG export capacity and could prolong competition between Europe and Asia for available cargoes.
The U.S. market sent a different signal. Henry Hub remained below $3/MMBtu, Lower-48 production stayed near record levels, LNG feedgas remained below its April peak, and storage was still 181 Bcf above the five-year average. The structural demand thesis continues to improve, but the domestic market has not yet tightened enough to reward gas producers consistently.
EnergyAlphaCo read: Global LNG conditions improved, but the U.S. balance remains loose until storage normalizes, production growth slows or LNG feedgas establishes new highs.
The week in one sentence
The global case for U.S. LNG strengthened, while the near-term case for higher Henry Hub prices weakened under the weight of production and above-normal storage.
That distinction is central to the investment thesis. A globally tight LNG market does not automatically create a tight U.S. gas market. Global scarcity must first translate into high utilization at U.S. export terminals, rising feedgas demand and a measurable reduction in domestic inventories.
1. Storage improved slightly—but remains a headwind
Verified facts
The Energy Information Administration reported that working gas in storage increased by 41 Bcf during the week ended July 10, bringing total inventories to 3,024 Bcf. The injection was close to the five-year average increase of 45 Bcf for the comparable week.
Inventories were:
· 181 Bcf above the five-year average
· Approximately 6% above normal
· Slightly improved from a surplus of 185 Bcf one week earlier
EnergyAlphaCo interpretation
Weekly signal: Slightly better, but not yet bullish
The storage surplus contracted by only 4 Bcf despite substantial summer cooling demand. That is directionally constructive, but it does not yet indicate an undersupplied market.
The current balance suggests that elevated power burn is still being offset by some combination of:
· Near-record dry-gas production
· LNG feedgas below its spring peak
· Temporary export-terminal interruptions
· Renewable generation reducing gas burn during certain hours
· Adequate regional pipeline capacity
Storage remains the most important bridge between the structural demand thesis and the commodity price.
A sustained 1 Bcf/d tightening in the market balance would equal approximately 365 Bcf over one year. That is more than twice the current storage surplus. Small changes in production, LNG feedgas or power demand can therefore become meaningful once the surplus begins to contract.
What would strengthen the thesis
The near-term setup would improve materially if the surplus falls toward 100 Bcf or less while LNG feedgas returns above 18 Bcf/d.
A surplus that remains near or above 175 Bcf through the remainder of the summer would indicate that production is still growing faster than effective demand.
2. Henry Hub reflects a loose summer and a cautious winter
Verified facts
The August Henry Hub contract settled at $2.888/MMBtu on July 16, its lowest closing level since May 12. Reuters attributed the decline to rising output, lower LNG export flows and ample storage.
The market continued to price a substantial winter premium, with January 2027 trading materially above the summer and shoulder-month contracts.
The July Short-Term Energy Outlook forecasts Henry Hub averaging close to $3.70/MMBtu in 2026, before declining below $3.50/MMBtu in 2027 as record production largely keeps pace with rising demand.
EnergyAlphaCo interpretation
Weekly signal: Weak prompt market; winter risk remains priced
The futures curve is not pricing a structural shortage. It is pricing a well-supplied summer market with meaningful seasonal risk during winter.
That matters for gas-sensitive equities.
A producer may benefit from winter months above $4, but a durable equity rerating generally requires higher prices across a larger portion of the forward curve. Isolated winter strength can be offset by weak spring and summer pricing, unfavorable hedges or elevated maintenance capital.
The current curve implies:
· Limited near-term support for producer cash flow
· Continued winter scarcity risk
· No market conviction that tightness will persist after winter
For the EnergyAlphaCo base case to strengthen, calendar-year 2027 pricing would need to move closer to or above $4—not merely the January contract.
3. Production remains the principal obstacle
Verified facts
LSEG estimated that Lower-48 natural-gas production averaged 110.3 Bcf/d in July, up from 110.0 Bcf/d in June and only modestly below the December 2025 record of 110.6 Bcf/d.
The EIA expects record natural-gas production to meet most of the increase in LNG exports, power-sector consumption and other demand. Its July outlook forecasts rising demand but also assumes that supply growth will prevent a sustained shortage.
EnergyAlphaCo interpretation
Weekly signal: Weaker domestic balance
The market does not currently have a demand problem. It has an abundant-supply problem.
The critical question is whether production can continue rising near current prices without requiring materially higher capital spending or a stronger Henry Hub signal.
Several supply sources matter:
Permian associated gas can grow because oil economics support drilling even when natural-gas prices are weak.
Haynesville production responds more directly to Henry Hub and Gulf Coast LNG demand.
Appalachian supply remains constrained more by transportation than by geological scarcity.
Producer productivity gains can allow output to rise without a proportionate increase in rigs.
The downside risk to the constructive thesis is that U.S. production proves capable of exceeding 115 Bcf/d at Henry Hub prices in the mid-$3 range or lower. If that occurs, the market may satisfy the next wave of LNG and power demand without requiring the price environment assumed in the EnergyAlphaCo base case.
4. LNG feedgas remains below its spring peak
Verified facts
Average feedgas flows to the nine major U.S. LNG export plants were approximately 17.4 Bcf/d in July, unchanged from June but below the monthly record of 18.8 Bcf/d reached in April.
The decline does not represent a reversal in the long-term LNG buildout. It reflects maintenance, outages and uneven project commissioning.
The EIA continues to expect U.S. LNG exports to grow materially through 2027 as Corpus Christi Stage 3, Golden Pass and other projects ramp.
EnergyAlphaCo interpretation
Weekly signal: Structurally positive, operationally uneven
Feedgas is the clearest measure of whether the LNG thesis is affecting the domestic gas balance today.
Project announcements and nameplate capacity are not enough. A terminal must be completed, commissioned, supplied by pipeline and operating consistently before it becomes durable gas demand.
The current 17.4 Bcf/d rate remains historically strong, but the gap between that level and the April peak is meaningful. A 1 Bcf/d reduction in feedgas has the same annualized storage impact as approximately 365 Bcf of additional supply.
The next bullish confirmation would be:
1. Feedgas returning above 18 Bcf/d
2. A new sustained record above the April peak
3. Golden Pass trains moving from intermittent commissioning to reliable operations
4. Corpus Christi Stage 3 continuing to ramp
5. Freeport and other existing terminals operating without extended interruptions
5. Global LNG tightened materially
Verified facts
Shipping activity through the Strait of Hormuz declined sharply during the week as U.S.-Iran hostilities escalated. Reuters reported that no LNG tankers crossed the strait for several days, even though Qatari and UAE production and terminal loadings continued. Loaded LNG cargoes consequently accumulated in and around the Persian Gulf.
The disruption is important because Qatar is one of the world’s largest LNG exporters, and the Strait of Hormuz is a critical route connecting Qatari supply with buyers in Asia and Europe.
A reported BloombergNEF forecast revision also pushed the expected beginning of a global LNG oversupply into 2028, reflecting Middle East disruption and recurring project delays. The forecast remains a third-party estimate rather than a verified physical outcome, but the timing revision is directionally important.
EnergyAlphaCo interpretation
Weekly signal: Stronger global setup
This week strengthened the case that the expected LNG supply wave may arrive later and less smoothly than consensus forecasts assume.
Repeated delays matter because global LNG balances are based on large projects entering service according to specific schedules. A six- or twelve-month delay at several facilities can materially tighten the market even when aggregate nameplate capacity appears sufficient on paper.
The effect on U.S. gas depends on where the delay occurs:
A delay to Qatari, Canadian or other non-U.S. supply is generally bullish for existing U.S. LNG utilization.
A delay to a new U.S. LNG facility postpones incremental feedgas demand and is less bullish for Henry Hub.
An outage at an operating U.S. terminal is directly bearish for near-term domestic gas demand.
A global shipping disruption can strengthen international prices but may not immediately increase U.S. feedgas if existing terminals are already near capacity.
The delayed-glut thesis should therefore be treated as a timing argument—not proof that global LNG oversupply has disappeared permanently.
6. Power demand remains the second structural driver
Verified facts
The EIA expects natural-gas consumption in the electric-power sector to rise in both 2026 and 2027, reaching a record 38.1 Bcf/d on an annual basis in 2027. Monthly power-sector consumption is forecast to reach 50.6 Bcf/d in July 2027.
The growth reflects rising electricity demand, additional gas-fired generation and relatively low natural-gas prices. Data centers, manufacturing and electrification are contributing to the broader power-load outlook.
EnergyAlphaCo interpretation
Weekly signal: Supportive
Power burn is becoming a more durable source of gas demand, but it remains sensitive to weather and competing generation.
High temperatures do not translate mechanically into gas consumption. Actual power burn also depends on:
Wind and solar output
Nuclear availability
Hydroelectric conditions
Coal dispatch
Transmission congestion
Regional gas prices
Plant outages
The investment case should therefore rely on actual measured gas burn and completed power projects, not gross data-center announcements or interconnection requests.
The longer-term opportunity remains credible: rising power demand increases the need for dispatchable generation, and natural gas is likely to retain an important role even as renewable capacity expands.
7. Infrastructure can strengthen demand—and release more supply
Permian takeaway
Reuters reported initial flows on Energy Transfer’s Hugh Brinson pipeline project, with the first major phase expected to enter full service later in 2026. Additional Permian takeaway can improve Waha realizations while allowing more associated gas to reach downstream markets.
Impact on Henry Hub: Moderately bearish
Improved takeaway reduces regional bottlenecks and allows gas produced alongside oil to compete with gas-directed production from the Haynesville and Appalachia.
Haynesville positioning
The Haynesville remains strategically positioned near Gulf Coast LNG terminals and southeastern power markets. Its principal constraint is less about immediate takeaway and more about the price and capital required to maintain production growth.
Impact on Haynesville producers: Constructive over time, but dependent on realized pricing and capital efficiency
LNG infrastructure
FERC’s June 30 terminal list confirms the scale of existing and approved U.S. LNG infrastructure, including Golden Pass and additional projects under development.
The relevant distinction for investors is between:
Operating capacity
Commissioning capacity
Capacity under advanced construction
Approved but unfunded capacity
Proposed capacity
Only the first three categories should receive significant weight in a near-term commodity model.
8. Implications for gas-sensitive equities
Dry-gas producers
Weekly signal: Mixed, with near-term pressure
Gas-focused producers retain substantial upside if Henry Hub moves sustainably into the $3.75–$4.50 range. The current prompt market below $3, however, limits near-term free cash flow and increases the importance of hedges, basis realizations and capital discipline.
Companies with high debt or high maintenance requirements remain particularly exposed.
Investors should favor producers that can:
Generate free cash flow below $4 gas
Maintain production without aggressive capital growth
Reduce net debt
Retain attractive market access
Avoid issuing equity
Preserve meaningful upside to stronger pricing
Comstock Resources
Comstock remains one of the more direct expressions of higher Henry Hub prices and Haynesville demand growth. Its Western Haynesville position provides proximity to Gulf Coast LNG and Texas power demand, but the investment case remains sensitive to drilling costs, decline rates, leverage and the timing of higher realized prices.
This week did not invalidate the long-term thesis. It reinforced that the thesis remains dependent on storage normalization and sustained feedgas growth rather than global LNG headlines alone.
Appalachian producers
EQT, Range Resources and Antero Resources may offer greater resilience through scale, transportation portfolios, low-cost inventory or liquids exposure. Their results must still be modeled using regional basis and realized pricing rather than Henry Hub alone.
LNG operators
Operating LNG companies are better positioned to benefit from global tightness than gas producers when domestic supply remains abundant.
Established operators with contracted capacity can benefit from:
High terminal utilization
Expansion opportunities
Marketing and optimization margins
Growing strategic importance
Their returns depend more on contract structure, construction execution and capital allocation than on outright Henry Hub appreciation.
LNG developers
Developers offer greater project upside but also greater risk from:
Construction delays
Cost overruns
Financing requirements
Joint-venture economics
Preferred securities
Common-equity dilution
A tightening LNG market does not automatically make every developer attractive on a fully diluted per-share basis.
Midstream and high-yield energy
Gas pipeline, gathering, compression and storage companies can benefit from rising LNG and power demand with less commodity exposure.
The most attractive projects are those supported by:
Firm long-term contracts
Strong counterparties
Controlled construction costs
Attractive returns on invested capital
Manageable leverage
Adequate distribution coverage
A high yield alone should never be treated as evidence of value.
9. What strengthened the thesis this week
The storage surplus contracted modestly.
Winter Henry Hub continued to carry a meaningful premium.
Global LNG shipping conditions tightened.
Existing U.S. LNG infrastructure became more strategically valuable.
The expected LNG oversupply period was reportedly pushed into 2028.
Long-term U.S. LNG export growth remained intact.
Power-sector gas demand remained on a record trajectory.
10. What weakened the thesis this week
Prompt Henry Hub remained below $3.
Lower-48 production stayed close to record levels.
Storage remained materially above the five-year average.
LNG feedgas remained below its April peak.
Additional Permian takeaway increased the potential supply response.
The forward curve continued to price winter tightness rather than a sustained structural shortage.
11. What EnergyAlphaCo is watching next
The most important near-term indicators are:
Storage
Does the surplus begin contracting meaningfully toward 100 Bcf, or does production keep inventories comfortably above normal?
LNG feedgas
Can total flows return above 18 Bcf/d and remain there?
U.S. terminal commissioning
Do Golden Pass and Corpus Christi convert construction milestones into stable, measurable feedgas demand?
Hormuz shipping
Do Qatari LNG cargoes resume normal transit, or does floating storage continue to accumulate?
Dry-gas production
Does Lower-48 output remain near record levels despite sub-$3 prompt pricing?
Power burn
Does elevated electricity demand produce tighter weather-adjusted storage balances?
Forward pricing
Does calendar-year 2027 Henry Hub move higher, or does strength remain concentrated in a few winter contracts?
Bottom line
The global LNG outlook strengthened this week, but the U.S. gas market remains well supplied.
That apparent contradiction is possible because the two markets are connected through finite liquefaction capacity. Global scarcity increases the value of U.S. exports, but it cannot draw unlimited gas from the domestic market. The bullish global signal becomes relevant to U.S. producers only when terminals operate at high utilization, new trains enter service and feedgas demand begins reducing storage consistently.
The EnergyAlphaCo thesis remains constructive because LNG exports and power consumption are creating durable demand that did not exist at the same scale during prior gas cycles.
But the thesis has not yet reached its decisive stage.
The next phase begins when global LNG tightness translates into record U.S. feedgas at the same time that storage normalizes and production growth begins to slow.
Until then, the market can remain globally tight and domestically oversupplied—and gas-sensitive equities should be selected based on free-cash-flow resilience, balance-sheet strength and fully diluted per-share value rather than commodity optimism alone.
Sources
Primary and supporting sources include the U.S. Energy Information Administration’s Weekly Natural Gas Storage Report and July 2026 Short-Term Energy Outlook, Federal Energy Regulatory Commission LNG terminal data, CME market pricing and Reuters/LSEG market and flow estimates.
Investment-risk disclosure
This material is provided for informational and educational purposes only and does not constitute individualized investment advice, a recommendation to purchase or sell any security, or an offer or solicitation to buy or sell securities.
Energy and commodity investments involve substantial risks, including commodity-price volatility, operational failures, project delays, construction-cost inflation, regulatory changes, leverage, dilution and geopolitical disruption. Forecasts, scenarios and interpretations may prove incorrect.
EnergyAlphaCo may discuss securities in which the author has a financial interest. Where applicable, ownership will be disclosed. Readers should conduct their own research and consider their objectives, financial circumstances and risk tolerance before making investment decisions.