
Opendoor Technologies: The Turnaround Is Becoming Visible - The Equity Still Has to Earn It
Lower acquisition costs, healthier inventory and a stronger funding runway justify attention.
Initial classification: Speculative Watchlist / High Risk / Proof Required
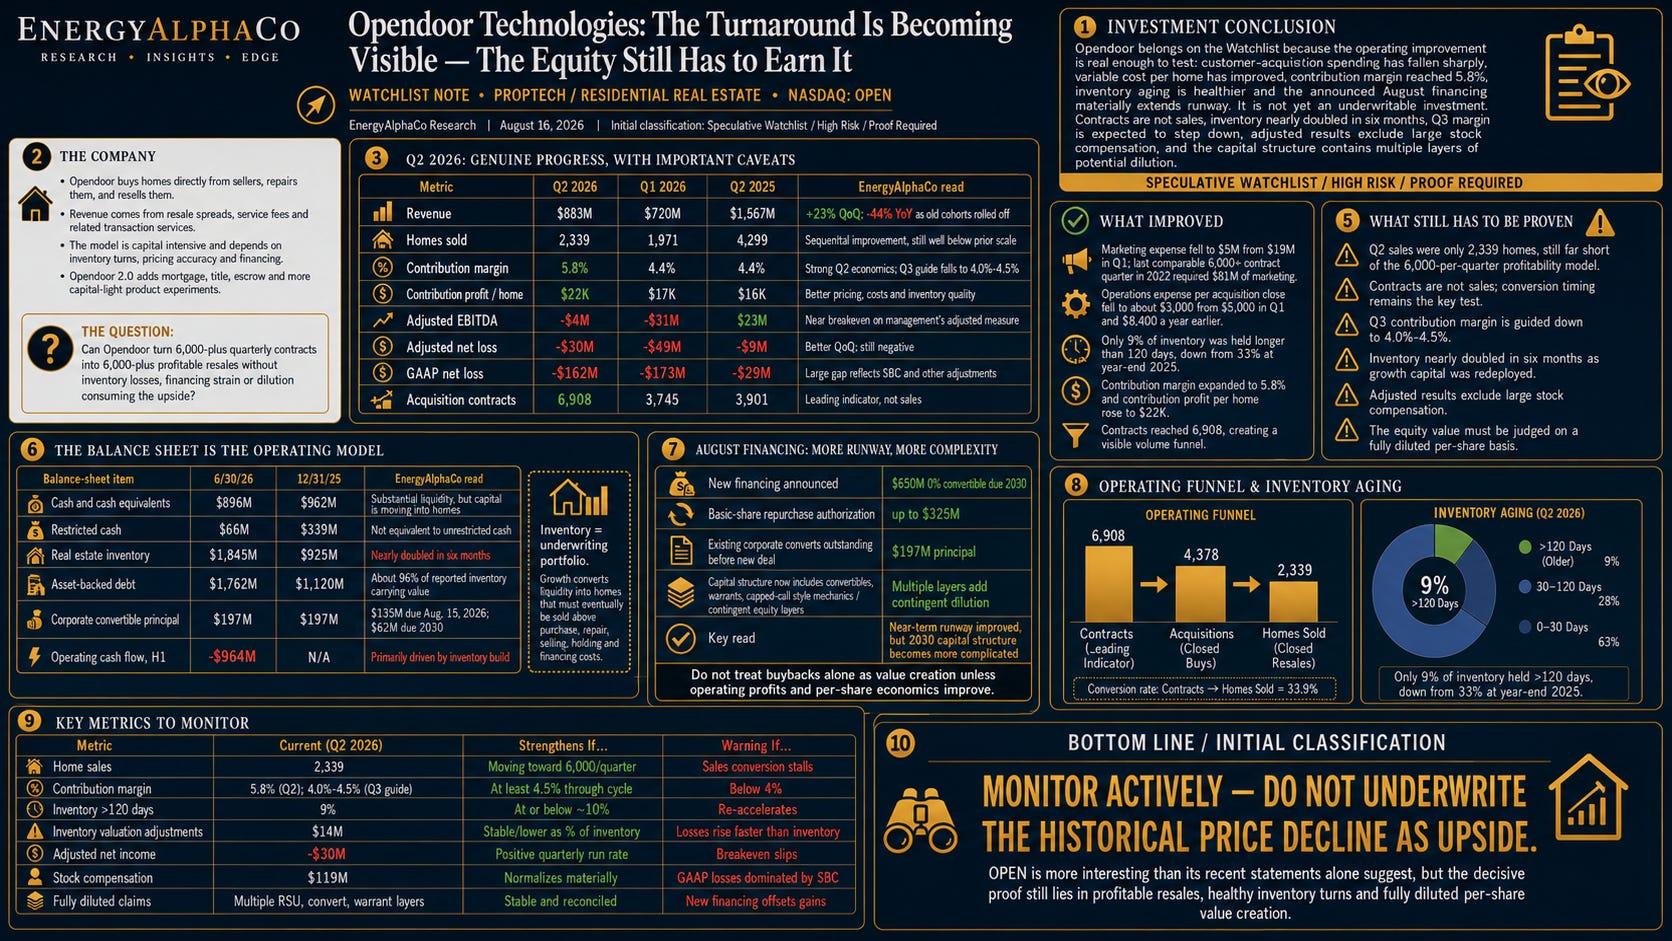
Investment conclusion
CONCLUSION Opendoor belongs on the Watchlist because the operating improvement is real enough to test: customer-acquisition spending has fallen sharply, variable cost per home has improved, contribution margin reached 5.8%, inventory aging is healthier and the announced August financing materially extends runway. It is not yet an underwritable investment. Contracts are not sales, inventory nearly doubled in six months, Q3 margin is expected to step down, adjusted results exclude large stock compensation, and the capital structure contains multiple layers of potential dilution. The next upgrade must be earned through profitable resales, cash discipline and per-share value creation.
Why OPEN is on the Watchlist
The market has already delivered the dramatic part of the story. Opendoor traded near $30 in February 2021 and is now $3.64, a decline of roughly 88%. That collapse alone is not a thesis. The company reported about 577 million shares outstanding in February 2021 versus 971 million in July 2026, before several contingent securities. The price chart therefore overstates how directly today’s equity can be compared with the old one.
The reason to watch is new management’s early operating evidence. Since Chief Executive Officer Kaz Nejatian arrived in September 2025, Opendoor has recast itself as a product- and artificial-intelligence-led platform, rebuilt acquisition channels, cut customer-acquisition cost, accelerated new contracts, reduced variable operating expense per home and cleared much of the stale inventory inherited from prior cohorts. Management is also expanding mortgage, title and escrow services and testing more capital-light products.
The reason not to advance beyond a Watchlist is that the financial statements still lag the narrative. Q2 sales were only 2,339 homes while acquisitions reached 4,378 and contracts reached 6,908. The company is rebuilding inventory and deploying borrowed capital several months before the corresponding resales and earnings appear. That transition may create value, but it is also the point at which underwriting mistakes become expensive.
The company in one paragraph
Opendoor offers homeowners a direct cash sale, then finances, repairs and resells the property. It earns a spread between acquisition and resale, service fees and related revenue, less renovation, selling, holding and financing costs. The model can provide speed and certainty to sellers, but it is capital intensive: growth requires more homes, more asset-backed debt and accurate pricing across thousands of local transactions. Opendoor 2.0 adds mortgage and other transaction services, a more flexible Cash Now, More Later product and, eventually, more third-party marketplace activity. Those adjacencies could improve lifetime value and reduce capital intensity, but the current financial engine remains owned inventory.
The basic investment question
THE QUESTION Can Opendoor convert its 6,900 quarterly contract pace into roughly 6,000 quarterly home sales at a contribution margin comfortably above the approximate 4.4% level needed for management’s profitability math - while keeping inventory turns, funding costs and the fully diluted share count under control?
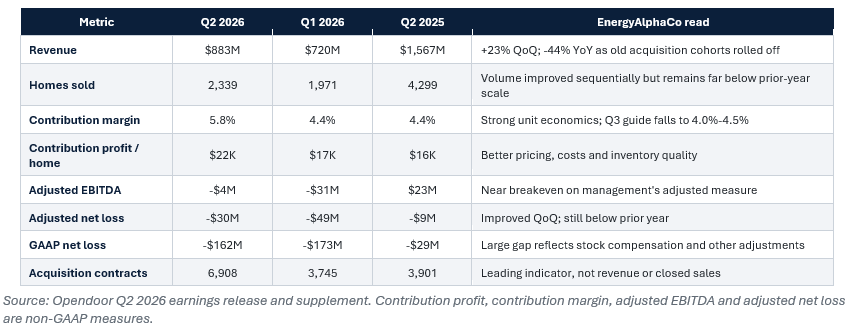
Q2 2026: genuine progress, with important caveats
What improved
Acquisition efficiency: Marketing expense fell to $5 million from $19 million in Q1. Management contrasted Q2 with the last comparable quarter above 6,000 contracts in 2022, when marketing expense was $81 million.
Variable operating cost: Operations expense per acquisition close fell to approximately $3,000 from $5,000 in Q1 and $8,400 a year earlier.
Inventory quality: Only 9% of inventory had been held longer than 120 days, down from 33% at year-end 2025 and below the 27% level management cited for the broader market.
Contribution economics: Contribution margin expanded 140 basis points year over year and sequentially, while contribution profit per home rose to $22,000.
Demand generation: Contracts reached 6,908, and management said the final week of Q2 approached 700 contracts. That gives the turnaround a visible volume funnel.
What did not improve enough
Revenue remains far below the scale management says is needed for sustainable profitability. Q2 annualized revenue was roughly $3.5 billion. Management’s illustrative model uses about 6,000 quarterly transactions at an average resale price of $375,000, or a $9 billion annual revenue run rate. The gap is not a rounding error: Q2 produced 2,339 sales, fewer than 40% of the volume in the model.
The margin bridge is also narrow. Management’s framework implies adjusted operating costs of roughly 2.4% of revenue and net interest a little above 2%. At a 4.0% contribution margin, the business would remain loss-making; near 4.4% it is approximately breakeven; and at 5.0%-5.8% it could produce roughly $50 million to $125 million of annual adjusted net income. Small changes in home-level margin therefore have large effects on equity value.
WATCHLIST READ Management calls the path to profitability a matter of math. The arithmetic is plausible. The underwriting problem is whether contracts convert on time, margins hold through resale, and the required inventory can be financed without absorbing the resulting value.
Contracts are not sales
A contract is a useful leading indicator, not an economic result. Some customers cancel, acquisitions take time to close, homes require repairs and listing, and resales depend on local demand and pricing. Q2 illustrates the timing gap: 6,908 contracts became 4,378 acquisitions, while only 2,339 homes were sold. The difference explains both the growth opportunity and the balance-sheet risk.
Management expects Q3 revenue to grow at least 20% from the $915 million reported in Q3 2025, implying at least about $1.10 billion. It also expects contribution profit to more than double year over year, but contribution margin is guided to 4.0%-4.5%, below Q2. The company can meet that guidance and still be well short of the 6,000 quarterly sales cadence behind the $9 billion model.
The most important near-term metric is therefore not the next contract headline. It is the conversion of contracts into sold homes, with cohort-level margin intact and without a new buildup of aged inventory.
The balance sheet is the operating model
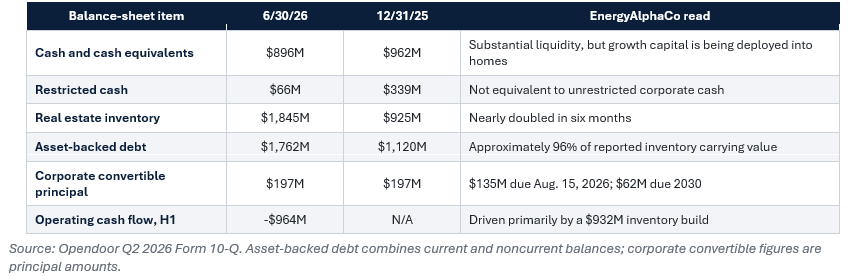
The $964 million first-half operating cash outflow is not the same as recurring operating burn: nearly all of it reflects higher inventory. That distinction matters, but it does not make the cash use irrelevant. Inventory must ultimately be sold above purchase, repair, selling, holding and financing costs. A growing inventory book converts liquidity into an underwriting portfolio.
At June 30, inventory included $496 million of work in progress, $1.04 billion listed for sale and $309 million under contract to sell. Opendoor also had 2,310 homes under contract to purchase for $736 million. Inventory valuation adjustments were $14 million in Q2 and $23 million in the first half. Those charges are manageable today, but they are an early warning system if acquisition speed outruns resale discipline.
The company reports $7.45 billion of nominal asset-backed facility capacity. Investors should not treat that figure as committed liquidity. Only $1.5 billion was committed in aggregate, and management disclosed that just $25 million of the $5.7 billion undrawn amount was committed at June 30. The model depends on lenders continuing to fund eligible homes on acceptable terms.
The August financing improves runway - and complicates the equity
On August 13, after the quarter-end materials, Opendoor announced agreements for $650 million of 0% convertible senior notes due in 2030. The transaction was expected to close August 19, subject to customary conditions. The initial conversion price is approximately $4.71. Opendoor plans to use about $158 million to repurchase approximately 45.3 million shares at $3.49 and approximately $52.5 million for capped-call transactions, leaving roughly $440 million before fees for general corporate purposes.
The structure is thoughtful. It reduces the basic share count by about 5%, adds a zero-coupon source of capital and uses the capped calls plus repurchase to limit near-term net dilution. The company estimates no net share issuance from the transaction until the stock exceeds $10.38. At the same time, the deal adds $650 million of senior unsecured debt that must eventually be repaid, refinanced or converted. It is growth capital, not free capital.
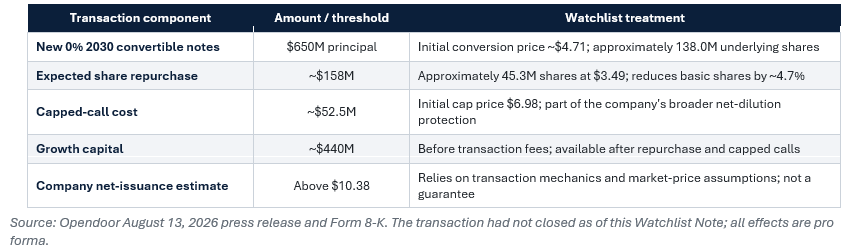
An illustrative June 30 bridge - not a company forecast - starts with $896 million of cash, subtracts the $135 million 2026 note maturity and the approximately $10 million July escrow acquisition, then adds roughly $440 million of announced growth capital before fees. That produces approximately $1.19 billion of pro forma cash before considering operations, inventory movements or other cash uses after June 30. The financing therefore materially improves runway, but it does not remove the need for profitable inventory turns.
Per-share analysis matters more than the headline share price
Opendoor reported 971.1 million common shares outstanding on July 28. The announced repurchase would reduce that figure to roughly 925.8 million, subject to closing and timing. The fully diluted economic claim is larger and more complicated.
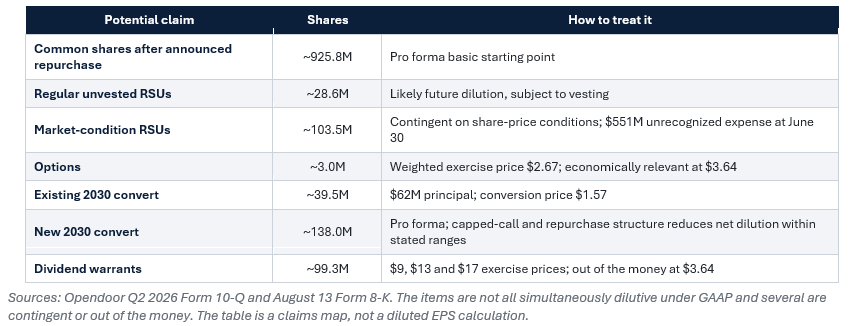
Adding every line mechanically would overstate current dilution because the new note is hedged within a price range, the market-condition awards are contingent, and the dividend warrants require much higher stock prices and provide exercise proceeds. Ignoring them would be equally misleading. A full Thesis Audit must reconcile basic shares, expected vesting, convertibles, warrants, capped calls and cash proceeds under multiple stock-price scenarios.
At $3.64, the July basic share count implies an equity value of approximately $3.5 billion. On the announced post-repurchase count, it would be about $3.4 billion. That is roughly equal to annualized Q2 revenue, but a 1-times revenue multiple is not automatically cheap for a capital-intensive business with low single-digit contribution margin and negative adjusted net income.
Valuation: the turnaround is already worth billions
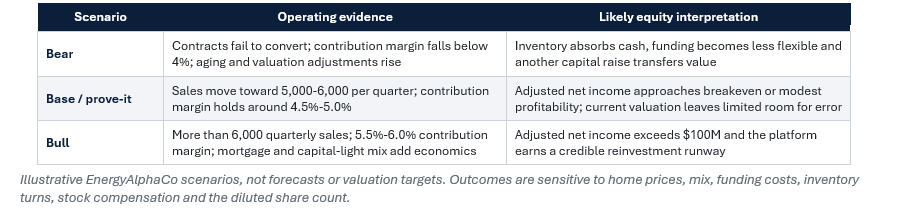
Management’s $9 billion revenue framework makes the stock look inexpensive at roughly 0.4 times that sales level. Sales are the wrong stopping point. Using management’s own cost architecture, contribution margin near 4.4% produces approximately breakeven adjusted net income; 5.0%-5.8% may produce roughly $50 million to $125 million. Against the announced post-repurchase equity value, that range would imply approximately 27 to 67 times adjusted net income.
Those calculations are deliberately rough and are not a price target. They show why the stock can be simultaneously far below its 2021 price and still require substantial operating success. The bull case needs both volume and margin; volume alone can consume capital, while margin without volume cannot absorb fixed costs and interest.
The macro backdrop is not providing a rescue
The company’s macro charts show a housing market that is functioning, but still constrained. Clearance rates improved from 2025 levels while remaining well below 2021-2022. New listings were healthy, yet active inventory and delistings remained elevated. Opendoor-weighted 30-day home-price appreciation improved seasonally, while year-over-year appreciation remained slightly negative.
Management described existing-home sales near a 4 million annual rate - roughly a 30-year low and about 20% below the pre-pandemic decade average - with mortgage rates in the mid-6% range, close to five months of supply and roughly flat year-over-year home prices. The Watchlist case should therefore assume no near-term macro bailout. Operational improvement must work in today’s market.
What the outside research gets right - and what still needs proof
The supplied Cestrian Capital Research article views OPEN as a hold only for aggressive, risk-tolerant investors. Its most useful contribution is skepticism about headline sales multiples and free cash flow during an inventory cycle. A thin revenue multiple can be misleading when contribution margins are narrow, debt finances inventory and trailing cash flow includes a prior inventory unwind.
Where the article is less decisive is the operating inflection. Q2 marketing efficiency, variable cost and inventory aging are meaningful improvements, not cosmetic ones. The fair synthesis is neither that Opendoor is broken nor that the turnaround is complete. The company has earned observation; it has not earned a durable earnings multiple.
What could make the case work
Efficient scale: The contract funnel converts into 6,000-plus quarterly sales while customer-acquisition and variable operating costs stay near current levels.
Durable unit economics: Contribution margin remains at least 4.5% through seasonal and geographic mix changes, with valuation adjustments controlled.
Higher-value services: Mortgage, title and escrow attach rates create incremental contribution profit rather than merely shifting revenue among products.
Capital-light mix: Cash Now, More Later and third-party marketplace activity grow into a disclosed, measurable share of transactions and reduce capital per sale.
Funding discipline: The August transaction closes as expected, inventory turns improve and additional financing is not needed before adjusted profitability is proven.
Technology as evidence: AI-driven underwriting and operating tools show up in lower error rates, faster turns, fewer markdowns and higher cash earnings per diluted share.
What must be proven before reconsideration
Two consecutive quarters in which home sales, not just contracts, move toward the 6,000-per-quarter model.
Contribution margin of at least 4.5% through a seasonally weaker period, with quarterly contribution profit approaching the level needed to cover adjusted operating expense and interest.
Inventory older than 120 days remains at or below approximately 10%, while valuation adjustments stay controlled as the book scales.
Adjusted net income turns positive on a quarterly run-rate basis and the GAAP loss narrows as stock compensation normalizes.
Operating cash use can be reconciled to profitable inventory growth, with improving turns and sufficient committed funding.
Mortgage and other services contribute identifiable incremental economics, not only product-launch anecdotes.
A fully diluted capitalization bridge shows that value per share improves after RSUs, convertibles, warrants, capped calls and repurchase effects.
Automatic pass conditions
Contribution margin falls below 4% outside a clearly explained and temporary mix effect.
Acquisitions continue to outrun resales for more than two quarters while aged inventory or valuation adjustments rise.
The approximate 6,000 quarterly sales requirement slips materially into 2027 without a lower-cost profitability bridge.
Committed asset-backed capacity or advance rates tighten enough to constrain inventory growth.
Another large equity or convertible financing is required before the company proves adjusted profitability and per-share value creation.
Mortgage attach rates or capital-light products fail to translate into disclosed contribution economics.
Management emphasizes contracts, AI or the historical share-price decline while cash earnings per diluted share fail to improve.
The stock rerates on narrative materially faster than the adjusted net-income evidence develops.
Key metrics to monitor
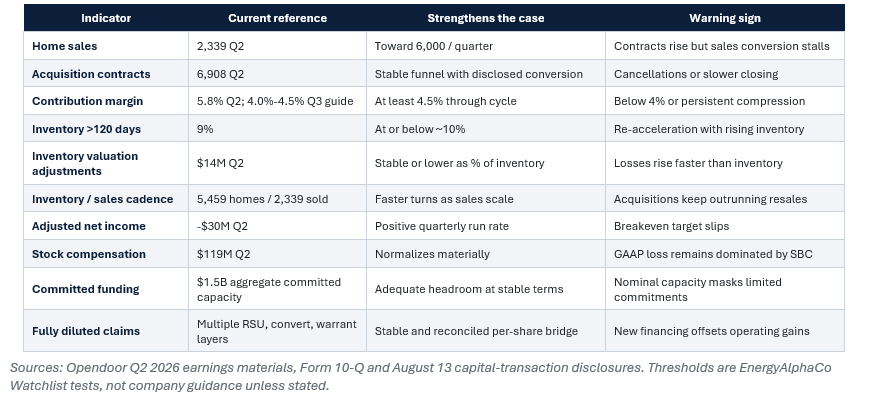
What would justify a full Thesis Audit?
A full Thesis Audit becomes worthwhile when Opendoor demonstrates that the operating funnel can be bounded in cash and per-share terms. The best trigger is not another price decline or contract record. It is a quarter in which resales move materially toward the required scale, contribution margin holds at or above 4.5%, inventory aging remains healthy and the company can reconcile the resulting cash economics after interest and stock compensation.
The full audit should model home-price and turnover stress by cohort; conversion from contracts to acquisitions and sales; margin after valuation adjustments; asset-backed advance rates and interest sensitivity; mortgage and capital-light contribution; and fully diluted shares under several stock-price scenarios. It should also test whether the 2030 capital structure creates more per-share value than a simpler financing path.
Initial classification
SPECULATIVE WATCHLIST / HIGH RISK / PROOF REQUIRED The turnaround has produced enough operational evidence to deserve continued work, and the August financing substantially improves the runway. The equity still depends on a narrow margin bridge, large inventory commitments and a complicated diluted-share structure. Monitor actively; do not underwrite the historical price decline as upside.
Final assessment
Opendoor is more interesting than its recent financial statements alone suggest. New management has sharply improved customer-acquisition efficiency, reduced variable costs, repaired inventory aging and rebuilt a contract funnel that could restore scale. The announced zero-coupon financing gives the company more time and capital to execute.
But the decisive results remain in front of the company. Q2 closed fewer than 2,400 sales against nearly 6,900 contracts. Inventory nearly doubled in six months, asset-backed debt funded most of the rebuild, Q3 margin is expected to decline, and GAAP losses remain burdened by substantial stock compensation. The new financing reduces near-term share count but adds a large 2030 obligation and more contingent equity mechanics.
At $3.64, OPEN is far below its 2021 peak, but it is not a simple fallen-growth bargain. The market is already assigning billions of dollars to the possibility that Opendoor 2.0 works. The company belongs on the Watchlist because the proof points are becoming measurable. It stays there until contracts become profitable resales, inventory becomes recurring cash and the economics improve on a fully diluted per-share basis.
THE WATCHLIST QUESTION Can Opendoor scale a better operating machine faster than inventory, financing and equity claims scale around it?
Sources
Opendoor 2020 Form 10-K, for February 2021 share-count context
Company-supplied Q2 2026 earnings supplement and macro charts, reviewed August 2026.
Market reference: $3.64 per share, August 14, 2026. Price-based calculations are time-specific and may change materially.
Disclosure
IMPORTANT Preliminary Watchlist research - not a completed Thesis Audit, individualized investment advice or a price target. OPEN carries housing, inventory, financing, execution, stock-compensation and dilution risks. Calculations are illustrative.