
Oil Macro Framework: How to Translate Oil Prices Into E&P Per-Share Value
A practical framework for moving from WTI and Brent to realized pricing, sustainable free cash flow, net debt and fully diluted equity value


Investment conclusion
An oil-price forecast is not yet an E&P investment thesis.
Knowing whether West Texas Intermediate trades at $50, $70 or $100 per barrel is important. But the benchmark price alone does not tell investors how much an exploration-and-production company is worth—or how much of that value belongs to each common share.
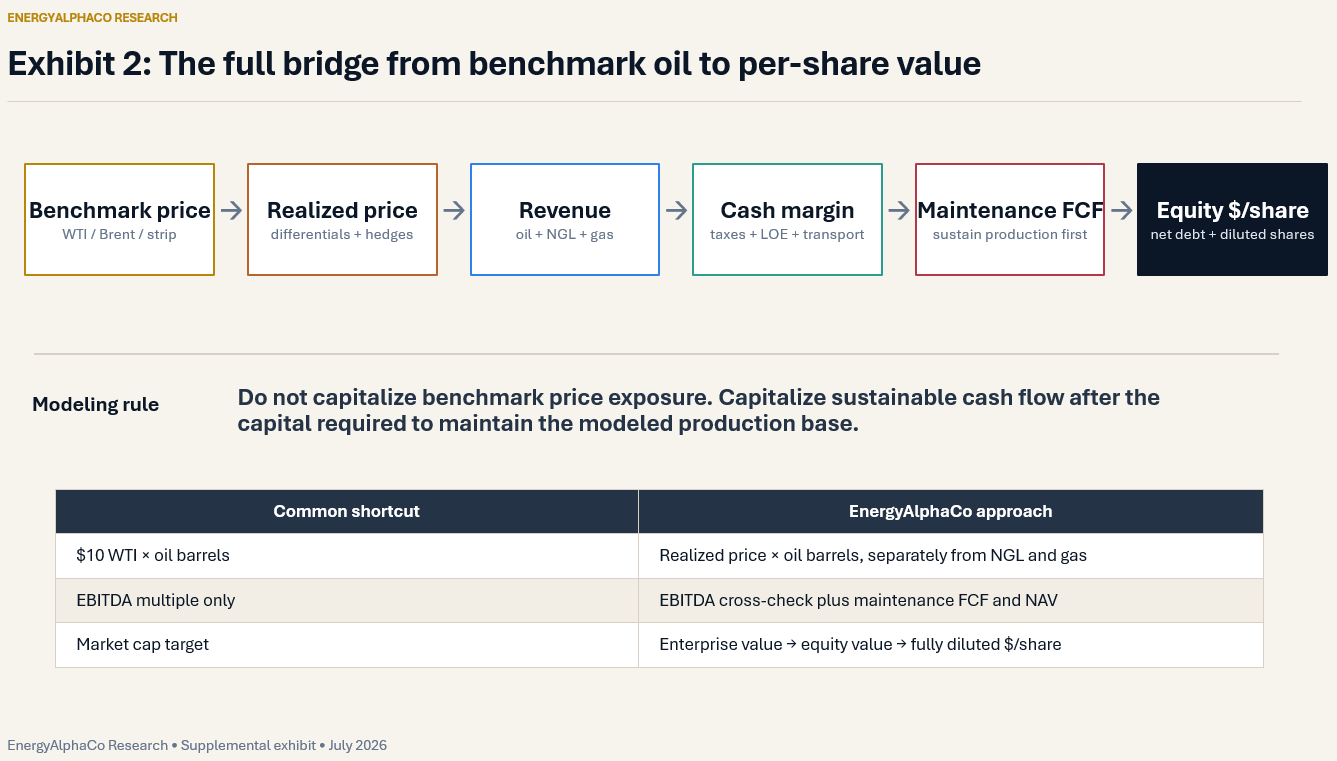
A defensible analysis must follow the entire economic chain: benchmark price, realized price, product revenue, cash operating margin, maintenance free cash flow, net debt, capital allocation, common equity value and fully diluted value per share.
Every step can materially change the result. Two producers can report similar oil volumes and react very differently to the same increase in WTI. One may have favorable differentials, limited hedges, low operating costs, manageable debt and a stable share count. Another may have capped hedge exposure, higher maintenance capital, rising service costs, substantial debt and a history of issuing stock for acquisitions.
Both companies benefit from higher oil prices. They do not benefit equally.

Why oil macro matters for equity investors
Oil is a globally traded commodity. E&P equities are company-specific claims on future cash flow.
Global demand, non-OPEC supply, OPEC production policy, effective spare capacity, inventories, geopolitical disruptions and refinery conditions establish the broad commodity environment. Those variables influence the benchmark price available to producers. Company economics determine how much of that price reaches shareholders.
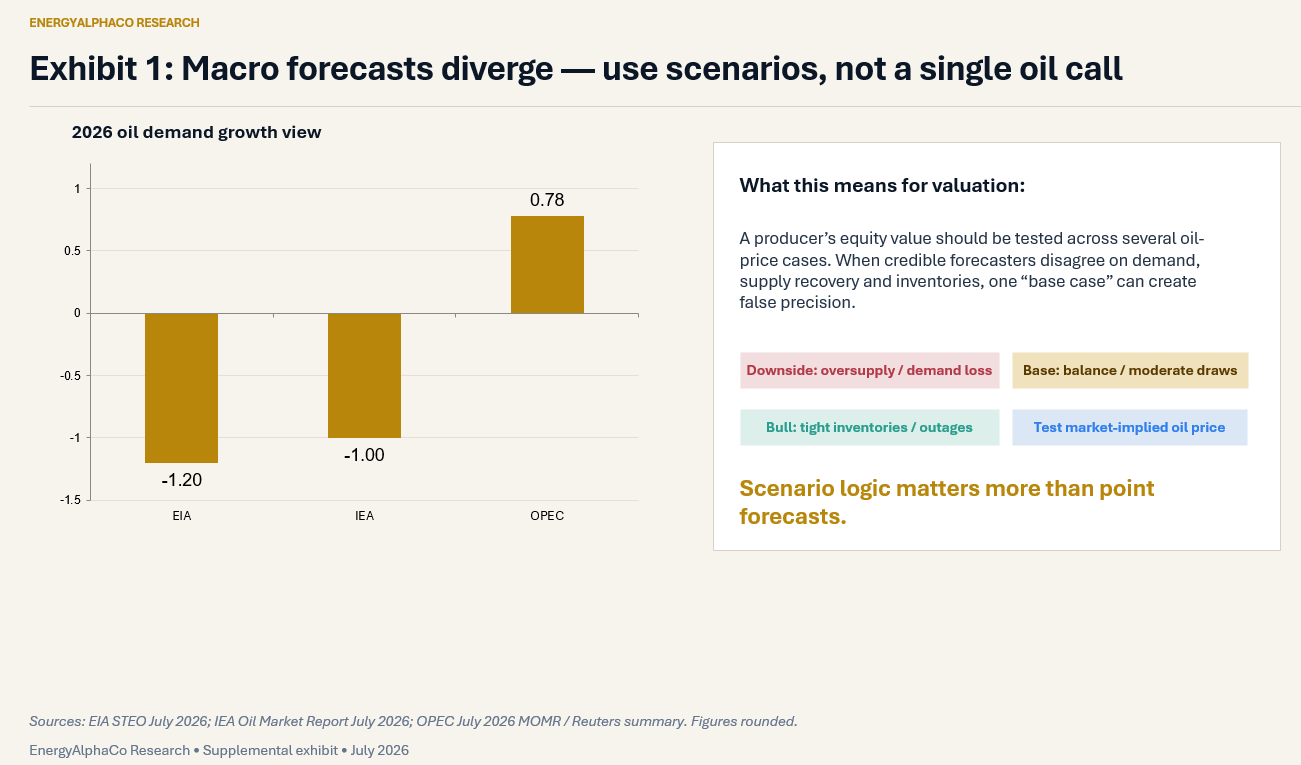
The current forecasting disagreement shows why investors should work with scenarios rather than a single authoritative-looking estimate. In July 2026, the U.S. Energy Information Administration projected that global oil consumption would decline by 1.2 million barrels per day in 2026, while the International Energy Agency projected a decline of 1.0 million barrels per day. OPEC projected growth of 0.8 million barrels per day. EIA also expected large near-term inventory draws to reverse into builds as disrupted production and trade normalized.
These are not minor differences. They can determine whether the modeled market is undersupplied, balanced or oversupplied. The practical response is not to choose the most bullish or bearish forecaster. It is to test the equity under several internally consistent price paths and identify what macro conditions would need to occur in each one.
• What oil price appears to be embedded in the stock?
• Can the company remain financially sound if the downside case occurs?
• How much value is created if the base or bull case occurs?
• Does the upside require only a higher oil price, or also exceptional company execution?
The common mistake: stopping at the oil price
A common shortcut begins with oil production and multiplies it by a change in WTI. Assume a producer sells 100,000 barrels of oil per day and WTI rises by $10 per barrel. The first-order benchmark exposure is $365 million per year.
That calculation is useful. It is not an estimate of additional free cash flow.
It assumes that every barrel receives the full increase, no production is hedged, differentials remain unchanged, volumes remain constant, production and cash taxes do not rise, service costs remain flat and no additional capital is required to replace decline. In practice, several of those assumptions may be wrong.
The full bridge has eight steps:
• Start with the relevant benchmark price and forward curve.
• Convert the benchmark into the company’s realized price.
• Apply realized prices separately to oil, NGL and natural-gas volumes.
• Deduct cash operating, transportation and production-tax costs.
• Deduct cash G&A, interest and taxes.
• Deduct the capital required to sustain the modeled production base.
• Model the use of free cash flow, including debt reduction and shareholder returns.
• Convert enterprise value into common equity value and divide by fully diluted shares.
The oil-price-to-cash-flow bridge
A company-level model should begin with production by commodity rather than total barrels of oil equivalent.

These revenue streams should be modeled separately because they respond to different benchmarks and can have very different margins. From production revenue, the model should deduct production and severance taxes, lease operating expense, workovers, gathering, processing, transportation, cash G&A, cash interest, cash taxes and other recurring cash obligations.
The result is cash flow before capital investment. The next deduction is the most important judgment in the framework: the capital required to sustain the production and asset capacity assumed in the valuation.

A producer can generate near-term cash by reducing drilling and allowing output to decline. That cash is real, but it may not be sustainable. A valuation that assumes flat production should not capitalize free cash flow created by shrinking the asset base unless the decline is explicitly modeled.
Production mix, differentials and realized pricing
The standard barrel-of-oil-equivalent conversion is an energy convention, not an economic equivalence. Six thousand cubic feet of natural gas does not normally generate the same revenue or cash margin as one barrel of oil.
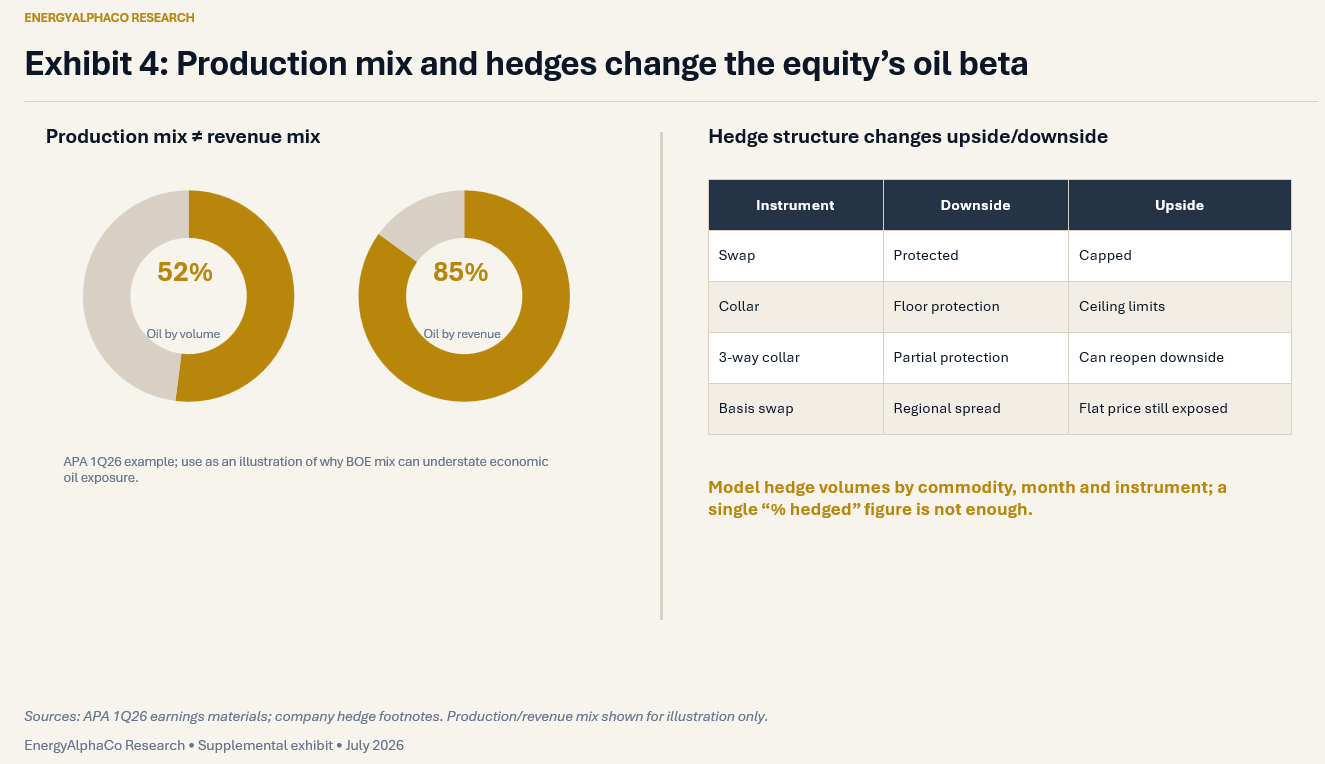
Investors should therefore examine production mix by physical volume and revenue mix by commodity. APA’s first-quarter 2026 results provide a useful illustration: oil represented approximately 52% of reported production but approximately 85% of oil-and-gas production revenue. A producer described as “50% oil” can be substantially more oil-weighted economically.
The next question is the benchmark. A U.S. producer may sell crude against WTI Cushing, WTI Midland, Louisiana Light Sweet or another regional index. International production may be linked to Brent, Dated Brent or a contract-specific formula.

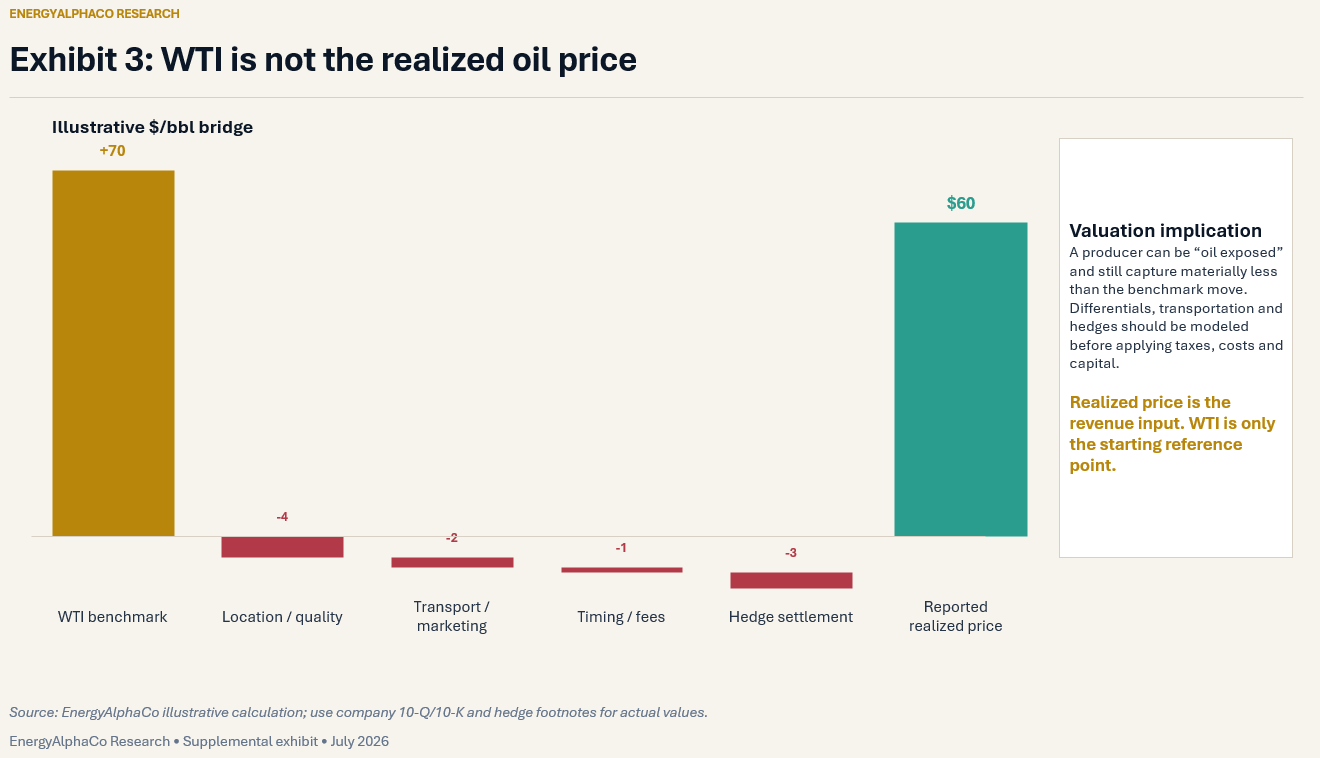
The differential can reflect crude quality, location, pipeline availability, firm transportation, gathering costs, export access, marketing arrangements and timing. A producer receiving a premium to WTI should not automatically be assumed to retain that premium indefinitely. The investor must determine whether it reflects a durable advantage or temporary regional conditions.
International barrels also require separate fiscal modeling. A higher Brent-linked realization may be offset by production-sharing terms, higher government take, windfall taxes, lifting schedules, receivable delays or decommissioning obligations. A higher reported price does not necessarily produce the same increase in after-tax free cash flow.
Hedges and why reported prices may lag the macro thesis
Hedges interrupt the direct relationship between the benchmark price and the producer’s reported realization. Common instruments include fixed-price swaps, collars, three-way collars, purchased puts, sold calls, basis swaps and differential hedges.
A fixed-price swap converts part of future production into a predetermined price. A collar protects a floor but may cap upside. A three-way collar can provide partial protection while reopening downside below the sold-put strike. A basis swap can protect a regional spread without protecting the absolute commodity price.
The effect is not inherently positive or negative. For a leveraged producer, downside protection can preserve liquidity and reduce the probability of distressed equity issuance. For a low-leverage producer in a rising market, extensive fixed-price hedges can transfer much of the upside to counterparties.
Devon disclosed in its 2025 Form 10-K that approximately 30% of its anticipated 2026 oil-and-gas production was hedged at that time. A single percentage is not enough to model the effect. Investors need the commodity, volume, instrument, strike, floor, ceiling, duration, basis exposure and any sold optionality.
The correct conclusion is not that hedges are always undesirable. It is that the hedge book changes both the magnitude and timing of the equity’s exposure to the macro thesis.
Operating costs, production taxes and transportation
Higher oil prices normally increase revenue faster than many field costs, creating operating leverage. But costs are not static through the cycle.
Production and severance taxes often rise directly with revenue. Lease operating expense can include field labor, electricity, fuel, chemicals, water disposal, compression, artificial lift, repairs and workovers. Some costs are fixed; others rise with activity, inflation, field maturity or produced-water volumes.
Transportation also requires careful treatment because companies report it differently. One producer may show transportation as a separate expense. Another may report revenue net of certain deductions. Peer comparisons therefore require an economic reconstruction rather than a simple comparison of reported line items.
Service-cost inflation can absorb part of the commodity benefit. The Dallas Fed’s second-quarter 2026 Energy Survey reported faster cost growth across oilfield-services inputs, finding-and-development costs and lease operating expenses. The survey indexes measure the breadth and direction of change; they are not percentage cost increases.
A credible bull case should not increase oil prices while leaving every operating and capital-cost assumption unchanged. Part of the upside can be captured by service providers, employees, governments and mineral owners before it reaches common shareholders.
EBITDA is not free cash flow
EBITDA and EBITDAX are useful measures of operating earnings before financing, taxes and noncash charges. They are not measures of cash available to shareholders.
EBITDA excludes cash interest, cash taxes, the capital required to replace production decline, abandonment spending and other recurring cash obligations. A producer can report attractive EBITDA while generating little sustainable equity free cash flow.
For this reason, EnergyAlphaCo uses EV/EBITDA as a valuation cross-check rather than the endpoint. The analysis should also show normalized maintenance free cash flow, net-debt trajectory and, where appropriate, asset-level NAV.
Maintenance capex versus growth capex
Maintenance capital is one of the most important and least standardized assumptions in E&P valuation.
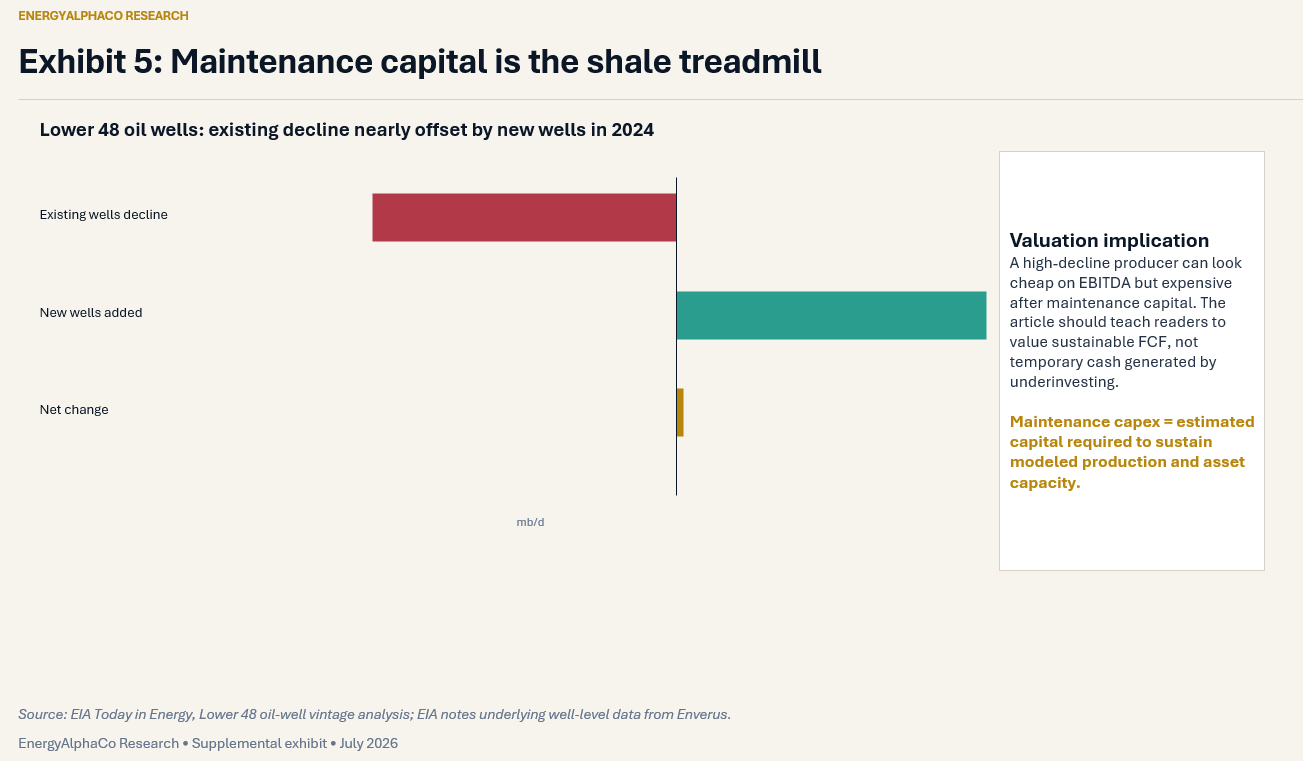
Shale wells generally produce rapidly at first and then decline. EIA estimated that Lower 48 oil production from wells online at the end of 2023 fell by approximately 4.3 million barrels per day during 2024. More than 15,000 new wells added approximately 4.4 million barrels per day, leaving only modest net growth despite a very large contribution from new completions. EIA notes that the underlying well-level data were supplied by Enverus.
That industry-wide example should not be used as the decline rate for an individual company. Corporate decline depends on basin, asset age, well type, completion cadence, conventional versus unconventional production, enhanced recovery, acquisitions, dispositions and non-operated interests.

A capital budget can include maintenance wells, growth wells, exploration, acreage, midstream, water infrastructure, environmental projects, major facilities, capitalized interest and capitalized G&A. The investor should try to separate those categories.
The strongest estimate uses several cross-checks: flat-production guidance, the historical relationship between capital and production, corporate decline, wells required to replace decline, completed-well cost, PDP reserve behavior and reserve-replacement economics.
Understating maintenance capital overstates free cash flow, debt-reduction capacity, repurchase capacity, free-cash-flow yield and equity value.
Free cash flow and the net-debt trajectory
Because companies define free cash flow differently, the calculation should be reconciled explicitly. EnergyAlphaCo separates cash flow before capital, estimated maintenance capital, growth capital, free cash flow after maintenance capital and free cash flow after total organic capital. Acquisitions and divestitures are shown separately.
Quarterly operating cash flow can also be distorted by receivables, payables, accrued capital, inventory, hedge collateral and the timing of international liftings. Underlying sensitivity is often best assessed before temporary working-capital changes, while actual liquidity and cash balances must still be tracked.
The destination of free cash flow matters as much as the amount. Cash can be used for debt reduction, dividends, repurchases, growth spending, acquisitions, preferred repayment or balance-sheet liquidity.
Debt reduction can increase common equity value even if enterprise value does not change. If a company retains a $10 billion enterprise value while net debt falls from $4 billion to $2 billion, common equity value increases from $6 billion to $8 billion—a 33% gain without multiple expansion.
The same leverage works in reverse. When free cash flow turns negative and debt rises, common equity absorbs a disproportionate decline. This is why a leveraged producer can offer powerful upside in a favorable cycle and unacceptable downside when the commodity thesis fails.
How oil prices affect per-share value
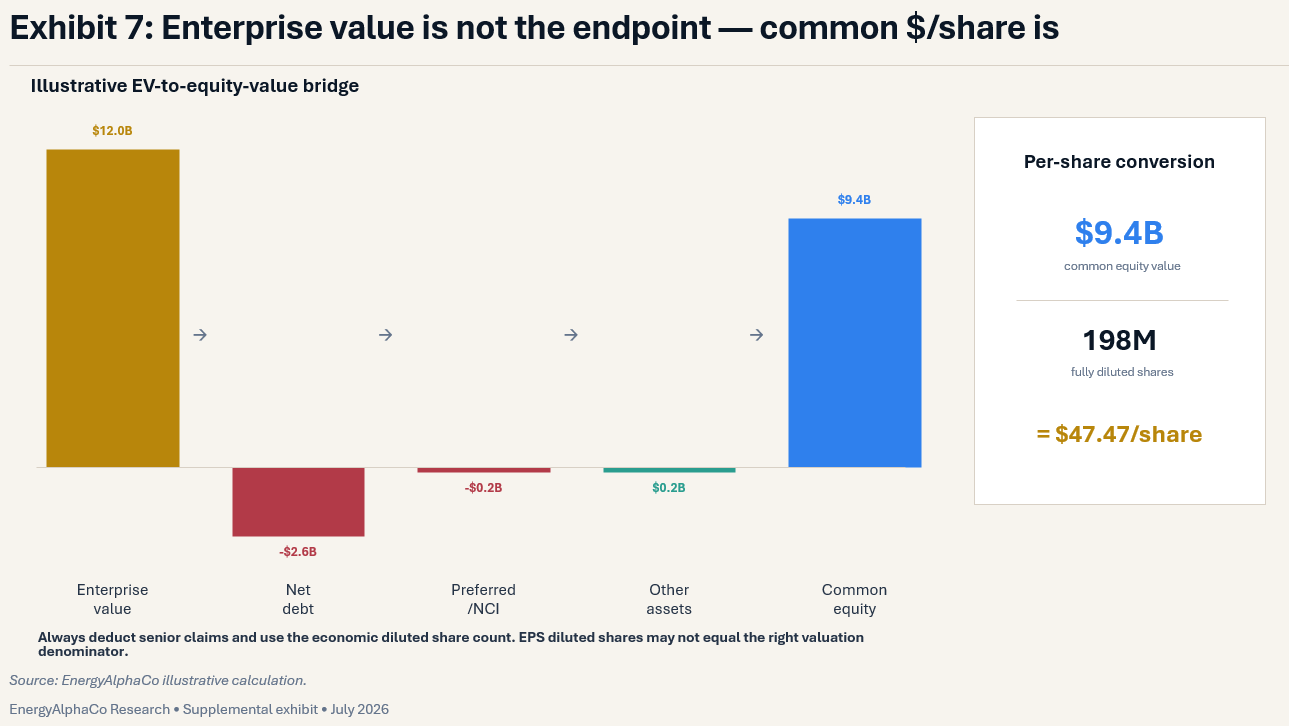
Once sustainable cash flow has been estimated, the analysis must move from operating value to common equity value.

Company-specific adjustments may include midstream interests, mineral interests, equity investments, expected asset-sale proceeds, unfunded acquisition consideration, decommissioning liabilities and working-capital deficits.

The denominator may include common shares, restricted stock units, performance awards, options, warrants, convertibles, partnership units, acquisition consideration and contingent shares. The diluted weighted-average count used for EPS may not be the right economic denominator for valuation.
Crescent Energy’s issuance of approximately 73.3 million Class A shares in connection with the Vital Energy transaction illustrates why acquisition growth must be judged per share. A transaction can increase production, EBITDA, reserves and enterprise value while failing to increase value for each pre-transaction share.
What the market may already be pricing in
A disciplined valuation should ask not only what the company could be worth, but also what commodity and operating assumptions are already embedded in the stock.
• Calculate market capitalization using the economic diluted share count.
• Add net debt, preferred securities and noncontrolling interests.
• Subtract material non-operating assets.
• Derive the market-implied enterprise value.
• Select a reasonable normalized valuation framework.
• Determine the EBITDA, free cash flow or NAV required to support that value.
• Solve for the commodity price and production assumptions that produce the required result.
For example, a company with $7 billion of common equity value and $3 billion of net debt has a $10 billion enterprise value. At 4.0 times normalized EBITDA, the market is implicitly assigning $2.5 billion of EBITDA. The operating model can then estimate which WTI price, production profile and cost structure produce that result.
This helps distinguish whether the market is pricing a high oil price, falling production, balance-sheet improvement, little value for undeveloped inventory or a lower multiple because current cash flow is viewed as unsustainable.
A stock can decline while oil rises if the market had expected an even higher price—or if production, cost, capital, hedge or dilution expectations deteriorate. Equity prices respond to the gap between outcomes and expectations, not simply the direction of WTI.
Scenario framework: downside through exceptional execution
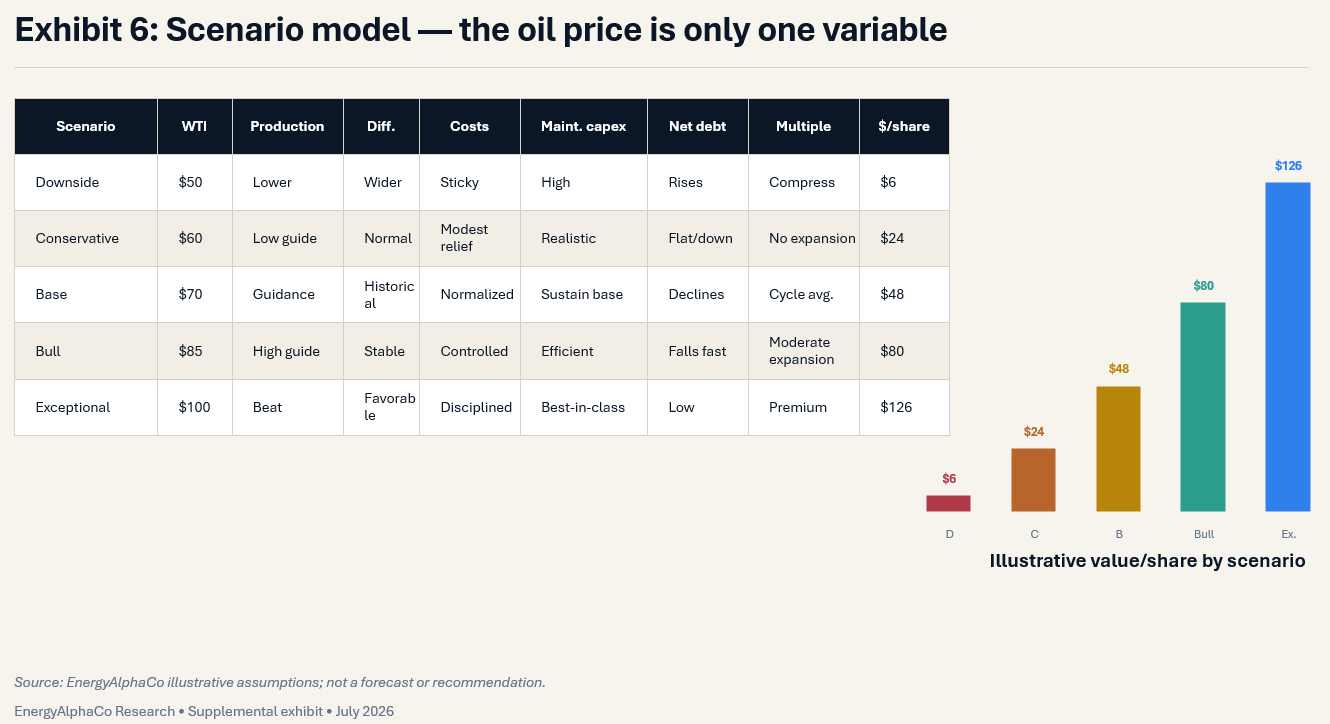
EnergyAlphaCo company models should normally include downside, conservative, base, bull and exceptional-execution cases. The following oil prices are illustrative assumptions, not forecasts.
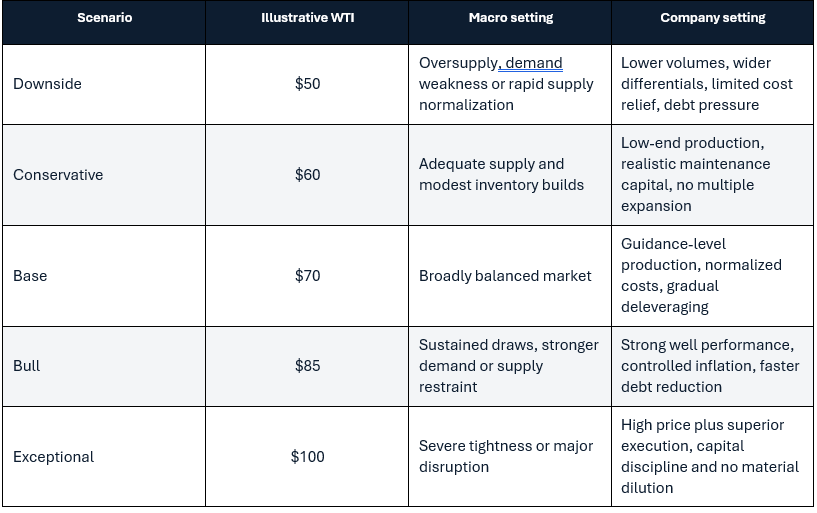
The oil price should not be the only variable that changes. Each scenario should define production, realized-price discount, hedge effect, cash costs, maintenance capital, free cash flow, ending net debt, shareholder returns, valuation method and fully diluted shares.
The downside case tests survival and financing risk. The conservative case tests underwriting without multiple expansion. The base case should not require every assumption to work perfectly. The bull case must explain why the producer retains commodity upside rather than spending it. Exceptional execution should require more than a high oil price; it should combine a favorable market with superior operations, balance-sheet improvement and disciplined capital allocation.
Which E&Ps benefit most?
The producers with the greatest potential benefit from higher oil prices usually combine several—not necessarily all—of the following characteristics.
High oil revenue exposure
Oil should represent a large share of revenue and cash margin, not merely BOE production.
Favorable realized pricing
Advantaged transportation, quality or export access can preserve more of the benchmark price.
Limited upside-limiting hedges
Unhedged production retains more upside, although appropriately hedged leverage can improve downside durability.
Low maintenance requirements
Lower corporate decline or stronger capital efficiency allows more operating cash flow to become sustainable free cash flow.
Low cash costs
Low LOE, transportation, G&A and interest expense create wider cash margins.
Manageable leverage
Moderate debt can create equity torque; excessive debt can transfer upside to creditors and increase refinancing risk.
High-quality inventory
Economic inventory must be evaluated through well productivity, completed-well cost, royalty burden, spacing, interference, infrastructure and development timing.
Capital-allocation discipline
Higher oil prices create durable value only when management resists uneconomic growth, overpriced acquisitions and repurchases above intrinsic value.
Stable or declining diluted shares
Per-share value improves only when repurchases exceed stock compensation and acquisition-related issuance and are made below intrinsic value.
No single characteristic is sufficient. An unhedged producer with excessive debt may have enormous upside but unacceptable downside. A low-debt producer with weak inventory may preserve capital but lack attractive reinvestment opportunities. The conclusion must reflect both expected return and the risk of permanent capital loss.
What investors should monitor
An oil-E&P thesis should be monitored through four connected scorecards.
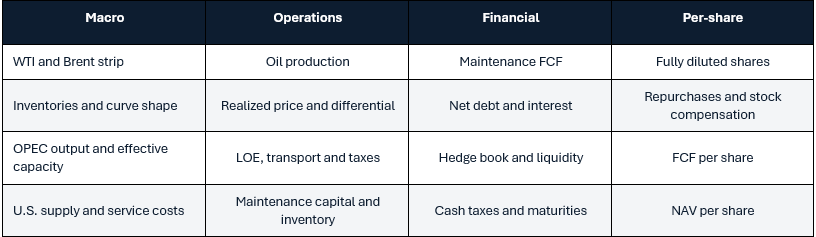
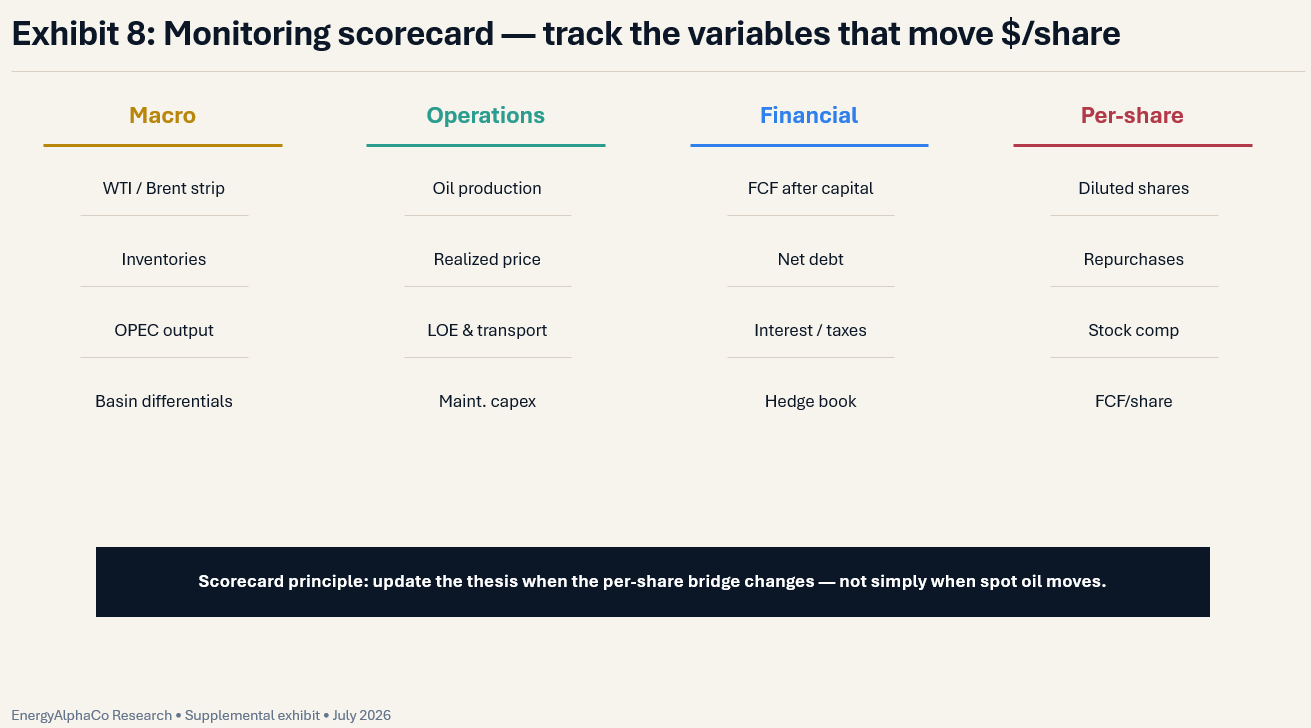
The scorecard should emphasize changes, not isolated quarterly results. A temporary production beat may matter less than a structural increase in maintenance capital. A large repurchase authorization may matter less than continuing dilution through stock compensation or acquisitions.
The thesis should be updated when the per-share bridge changes—not simply when spot oil moves.
Thesis breakers
A serious oil-equity thesis identifies the developments that would weaken or invalidate its valuation logic. Potential thesis breakers include:
• The assumed oil-price environment does not occur or the forward curve weakens materially.
• Production declines faster than modeled and requires more capital to sustain.
• Maintenance capital proves materially higher than estimated.
• Service, labor, fuel, steel or workover inflation absorbs most of the commodity benefit.
• Differentials widen structurally because of infrastructure, quality or regional demand.
• Hedges cap realizations for longer than expected.
• Free cash flow fails to reduce net debt because it is consumed by acquisitions, distributions or cost overruns.
• Inventory quality deteriorates, spacing assumptions prove aggressive or the company moves into lower-return acreage earlier than expected.
• Stock compensation, acquisition shares, convertibles or financing issuance increase the diluted share count.
• Fiscal, regulatory or decommissioning obligations materially reduce after-tax value.
A falling share price is not itself a thesis breaker. The thesis breaker is the underlying operational, financial or macro development that makes the original cash-flow and valuation assumptions no longer credible.
Final assessment
Oil prices matter enormously to E&P equities. But the benchmark price is the beginning of the analysis, not the conclusion.
The most attractive producer is not necessarily the company with the most barrels, the greatest stated oil sensitivity or the highest free-cash-flow yield at spot prices. It is the company that can realize a high percentage of the benchmark price, sustain production at a reasonable capital cost, control operating expenses, protect the balance sheet, avoid unnecessary dilution and allocate cash at attractive per-share returns.
Investors should also distinguish commodity upside from company execution. A producer whose shares rise solely because oil rises may still have weak operations or poor capital allocation. A producer that improves realizations, lowers maintenance capital, reduces debt and shrinks its diluted share count can create value without relying on permanent multiple expansion.

That is the standard EnergyAlphaCo will apply to future work on APA, Crescent Energy, Devon, Diamondback, EOG, Magnolia, Matador, Ovintiv, Permian Resources, SM Energy, Northern Oil and Gas and other oil-weighted E&Ps.