
Natural Gas & LNG Scorecard
Week ended August 14, 2026. MACRO ASSESSMENT 6.5 / 10 Down modestly from 6.8 last week. Near-term supply evidence strengthened, while the 2028 deliverability thesis remained intact.
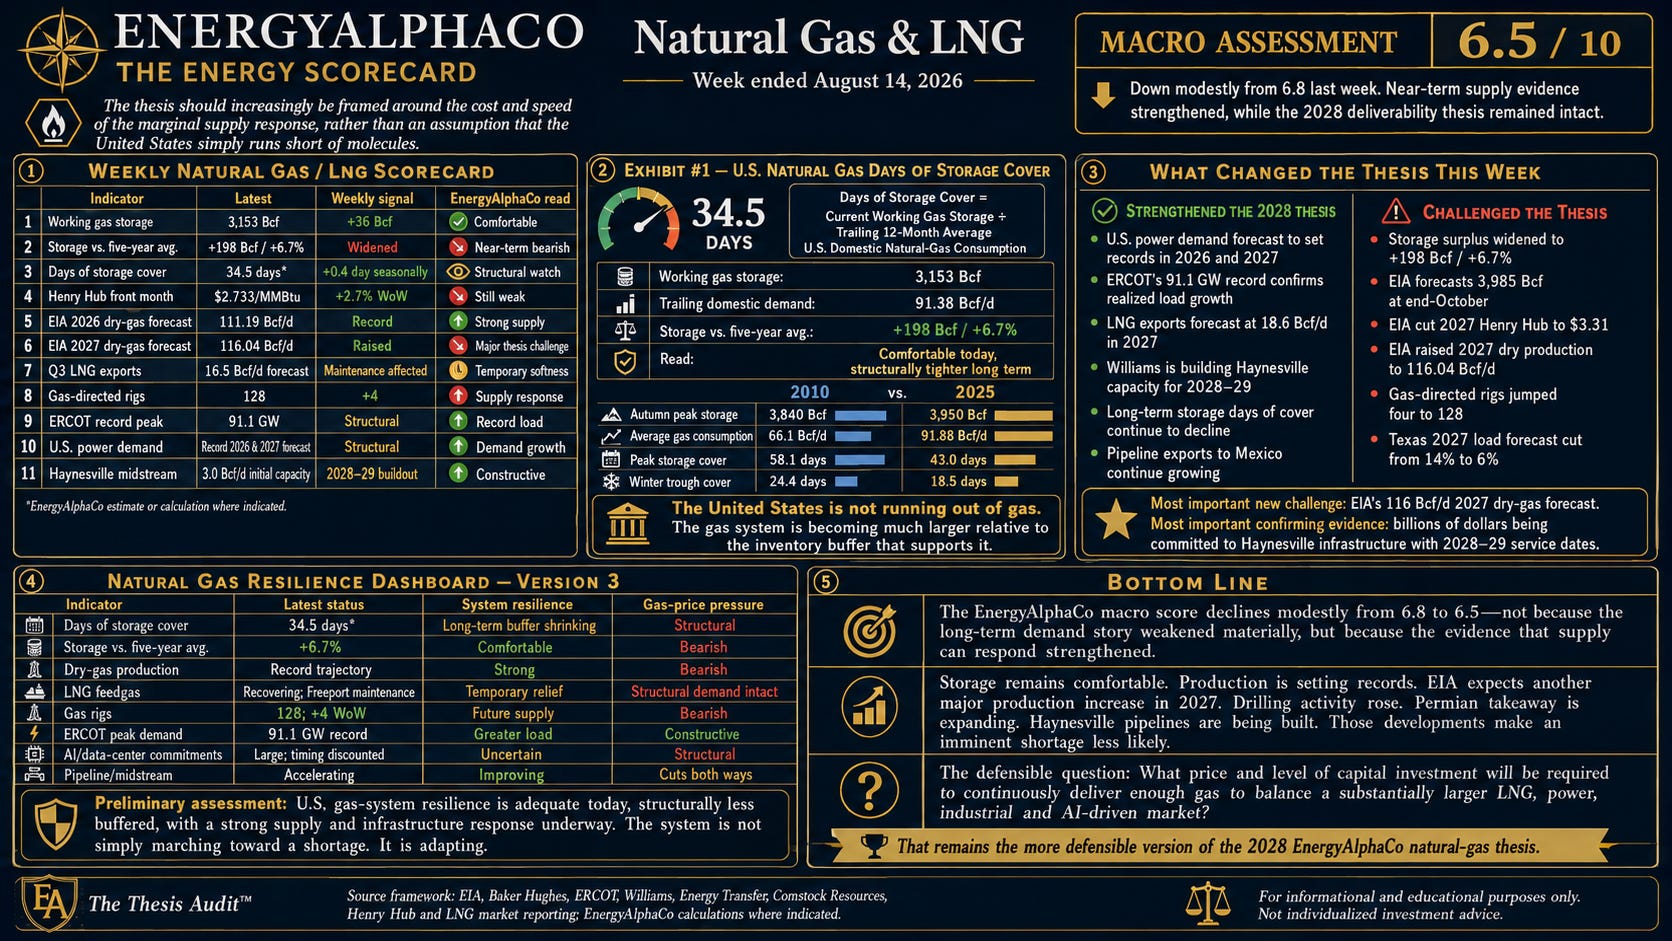
This was a more challenging week for a natural-gas scarcity thesis, but not necessarily for the broader 2028 deliverability thesis.
Storage rose by more than expected, the five-year surplus widened again, gas-directed rigs jumped, and EIA materially increased its 2027 production outlook while cutting its Henry Hub forecast. Yet electricity demand is still projected to set records, LNG exports continue expanding, and billions of dollars are being committed to Haynesville infrastructure scheduled for 2028–29.
ENERGYALPHACO READ The thesis should increasingly be framed around the cost and speed of the marginal supply response, rather than an assumption that the United States simply runs short of molecules.
U.S. Natural Gas Days of Storage Cover
Current reading: 34.5 days
EIA reported 3,153 Bcf of Lower-48 working gas in storage for the week ended August 7, following a 36 Bcf injection. Inventories were 198 Bcf above the five-year average, or approximately 6.7% above normal. The build exceeded both the five-year average addition of 33 Bcf and the roughly 30 Bcf expected in a Wall Street Journal survey.
For the recurring EnergyAlphaCo measure, the standardized formula is:
FORMULA Days of Storage Cover = Current Working Gas Storage ÷ Trailing 12-Month Average U.S. Domestic Natural-Gas Consumption
EIA monthly consumption data from June 2025 through May 2026 total approximately 33.35 Tcf, equal to 91.38 Bcf/d. Dividing 3,153 Bcf by 91.38 Bcf/d produces 34.5 days of cover. This is an EnergyAlphaCo calculation. June 2026 monthly consumption has not yet been published, so May remains the latest month in the trailing denominator.
The historical comparison is becoming increasingly useful
The correct seasonal terminology is autumn refill-season peak, rather than summer peak.
In 2010, Lower-48 storage bottomed at 1,614 Bcf on March 12 and reached a refill-season high of 3,840 Bcf on November 5. Average U.S. gas consumption was about 66.1 Bcf/d. That equates to roughly 24.4 days of cover at the trough and 58.1 days at the peak.
In 2025, storage bottomed at 1,698 Bcf on March 7 and peaked at 3,950 Bcf on November 7. Average domestic consumption was approximately 91.88 Bcf/d, producing only about 18.5 days of cover at the trough and 43.0 days at the refill-season peak. These are EnergyAlphaCo calculations using EIA data.
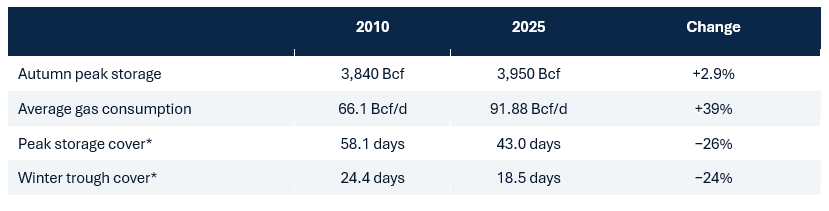
STRUCTURAL POINT The amount of gas in storage at the seasonal peak increased slightly. The size of the gas system increased dramatically faster.
Physical storage capacity is also expanding slowly. EIA reported that demonstrated Lower-48 peak storage capacity increased only 0.1%, or 6 Bcf, during 2025, while design capacity increased 26 Bcf to 4,683 Bcf.
This does not indicate resource scarcity. It indicates that storage provides a progressively smaller buffer relative to the system it supports.
Source: EIA weekly storage, monthly consumption and storage-capacity data; EnergyAlphaCo calculations.
Weekly Natural Gas/LNG Scorecard
1. Storage — near-term balance loosened again
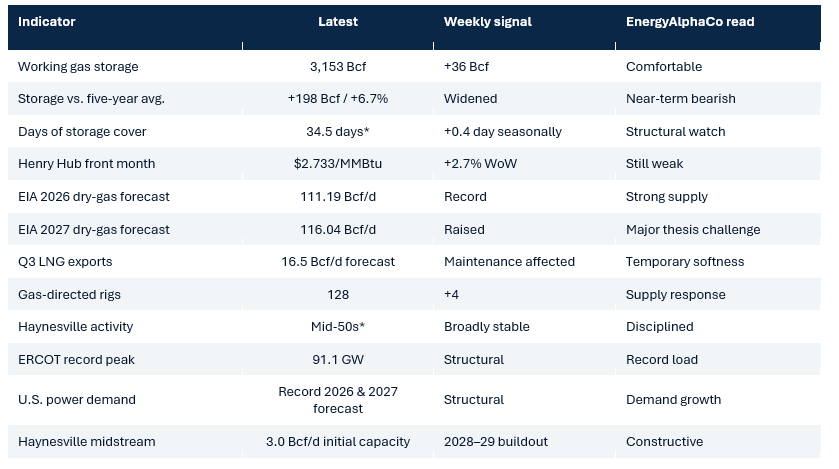
The 36 Bcf injection was the clearest bearish datapoint of the week. It exceeded the five-year average 33 Bcf build despite strong summer electricity demand and widened the inventory cushion from 195 Bcf to 198 Bcf above normal.
More important, EIA’s August outlook now expects inventories to reach 3,985 Bcf at the end of October, 19 Bcf above its July forecast and roughly 5% above the five-year average. EIA says that would represent the highest pre-winter inventory since 2016.
ENERGYALPHACO READ Bearish near term. Strong summer power demand has not yet prevented the industry from rebuilding inventories. A convincing tightening thesis would require the surplus to shrink consistently on a weather-adjusted basis.
High storage today and declining long-term days of cover can both be true simultaneously. The first describes the current commodity balance; the second describes structural system resilience.
Source: EIA Weekly Natural Gas Storage Report and August Short-Term Energy Outlook.
2. Henry Hub — the market still says “show me”
September natural-gas futures finished August 14 at $2.733/MMBtu, up 2.7% for the week. The rebound reflected recovering LNG feedgas, strong pipeline exports to Mexico and continued heat-driven power demand, but the market remained comfortably below $3.
The more important development came from EIA’s August 11 outlook. EIA cut its Q3 Henry Hub forecast to $2.87/MMBtu, down $0.50 from the prior month, and now expects annual Henry Hub prices of $3.44 in 2026 and $3.31 in 2027. It expects prices to remain below $3 until November.
The forward structure remains seasonal rather than scarcity-driven.
ENERGYALPHACO READ The market is pricing ordinary seasonal tightening—not a structural deliverability problem.
That makes the longer-dated strip one of the most important indicators in future Scorecards. The thesis becomes materially more investable when anticipated demand raises the durable 2027–29 strip, not simply the January winter contract.
Source: EIA August Short-Term Energy Outlook and August 14 Henry Hub market reporting.
3. Production and rigs — the strongest challenge to the thesis
The August outlook forecasts U.S. dry-gas production averaging 111.19 Bcf/d in 2026 and 116.04 Bcf/d in 2027, compared with 107.64 Bcf/d in 2025.
The latest publicly verifiable July estimates put Lower-48 dry production around 110.7 Bcf/d. Rather than infer an August daily figure without a clean current source, the Scorecard retains 110–111 Bcf/d as the current production regime and uses EIA’s updated annual outlook for forward analysis.
EIA expects Permian gas production to average 29.2 Bcf/d in 2026, up 6%, while Haynesville production increased about 1.1 Bcf/d, or 7%, in the first half of 2026 and is forecast to grow 9% for the full year.
The drilling response accelerated: gas-directed rigs increased four to 128 on August 14, reversing the prior week’s three-rig decline. Total U.S. rigs rose five to 593.
ENERGYALPHACO READ The thesis is challenged. The industry is responding. The harder question is how far production can keep growing before it moves further up the cost curve, requires materially more capital or encounters gathering, processing and takeaway limitations.
Source: EIA August outlook and basin production analysis; Baker Hughes rig count.
4. LNG — near-term maintenance, structural demand intact
LNG feedgas was recovering by Friday, August 14, but Freeport maintenance continues to distort near-term numbers. EIA says maintenance began July 10 and is expected to run through late August, temporarily affecting 2.0 Bcf/d of nominal export capacity. EIA reduced its Q3 LNG export forecast by 0.2 Bcf/d to 16.5 Bcf/d.
The structural trajectory remains much stronger. EIA expects U.S. LNG exports to average 17.4 Bcf/d in 2026 and 18.6 Bcf/d in 2027, versus 15.1 Bcf/d in 2025.
Pipeline exports are increasingly relevant. EIA forecasts 9.6 Bcf/d in 2026 and 10.0 Bcf/d in 2027. Mexico’s Energia Costa Azul shipped its first LNG cargo on July 8 and adds roughly 0.4 Bcf/d of nominal export capacity, sourced from U.S. Permian gas. New Mexican gas-fired generation also supports pipeline demand.
ENERGYALPHACO READ This week’s LNG softness looks more like maintenance noise than deterioration of the structural export thesis.
Source: EIA August outlook and LNG maintenance/export reporting.
5. Power and AI — powerful demand, but discount the queue
EIA forecasts total U.S. electricity consumption rising from a record 4,195 billion kWh in 2025 to 4,268 billion kWh in 2026 and 4,391 billion kWh in 2027, with AI/data centers and electrification contributing. Natural gas is expected to retain roughly 40% of U.S. generation in both 2026 and 2027, even while renewables gain share.
ERCOT’s official 2026 peak remains approximately 91.1 GW on July 22, versus the prior record of roughly 85.5 GW. That is observable load growth—not simply a forecast.
But Texas paused new data-center development approvals, and EIA subsequently cut expected 2027 Texas electricity-load growth to 6% from 14% in the previous outlook.
EVIDENCE HIERARCHY Announced load → contracted load → permitted load → financed load → connected load → operating load
Every announced gigawatt should not receive equal weight.
ENERGYALPHACO READ AI remains structurally constructive for natural gas, but demand needs a probability adjustment. Infrastructure, regulation, transmission and generation availability can delay load even when underlying demand exists.
Source: EIA electricity outlook and ERCOT operating data; Texas data-center approval developments.
6. Haynesville and pipelines — the infrastructure response is visible
Williams’ Momentum Midstream acquisition remains one of the most important pieces of evidence for the 2028 thesis. The acquired system includes more than 4,000 miles of pipe, 6 Bcf/d of gathering capacity and 4.05 Bcf/d of take-or-pay pipeline capacity in the Haynesville corridor.

Together, the projects represent 3.0 Bcf/d of initial incremental capacity aimed at growing Gulf Coast LNG and power demand.
The Permian is responding as well. Energy Transfer’s Hugh Brinson pipeline is expected to add 1.5 Bcf/d in its first phase in late 2026 and another 0.7 Bcf/d in early 2027, improving Permian access to East Texas markets.
This cuts both ways: new infrastructure strengthens system resilience, but also brings additional associated Permian gas into markets where Haynesville producers compete.
ENERGYALPHACO READ Infrastructure constraints are real—but capital is already being deployed to solve them. A successful 2028 thesis must incorporate the supply response rather than assume today’s infrastructure remains frozen.
Source: Williams Momentum transaction and expansion announcements; Energy Transfer Hugh Brinson project disclosures.
7. Comstock Resources — the macro setup became more demanding
There was no material new CRK company-specific catalyst this week, so the more useful exercise is assessing how the macro evidence changes the thesis.
Comstock’s Q2 results demonstrated operating capability: production reached 113.1 Bcfe, up 16% sequentially, and Western Haynesville wells continued to show high initial production rates. Q2 realized price was $2.55/Mcfe before hedges and $2.93/Mcfe including hedges.
Negative evidence strengthened: prompt gas remains below $3, storage is 6.7% above normal, EIA increased its 2027 supply forecast to 116.04 Bcf/d, gas rigs rose to 128 and Permian takeaway continues expanding.
The structural positives remain substantial: Haynesville production is growing, Williams is investing heavily in the corridor CRK serves, and new capacity is scheduled for 2028–29 when LNG and power demand should be much larger.
CENTRAL CRK QUESTION Can Western Haynesville become a sufficiently low-cost source of incremental gas that the value created by higher future prices exceeds the drilling capital, infrastructure requirements, leverage and dilution required to produce it?
That is a better thesis than simply saying gas prices will rise.
For EQT, Expand Energy, Range Resources and Antero, low-cost resource is valuable, but the biggest equity upside likely requires a higher durable forward strip rather than temporary weather-driven spikes. For midstream companies, the evidence is arguably cleaner: the system needs incremental gathering, compression, processing and long-haul transportation across a wide range of Henry Hub outcomes.
Source: Comstock Resources Q2 2026 results; EIA, Baker Hughes and pipeline project sources cited above.
Natural Gas Resilience Dashboard
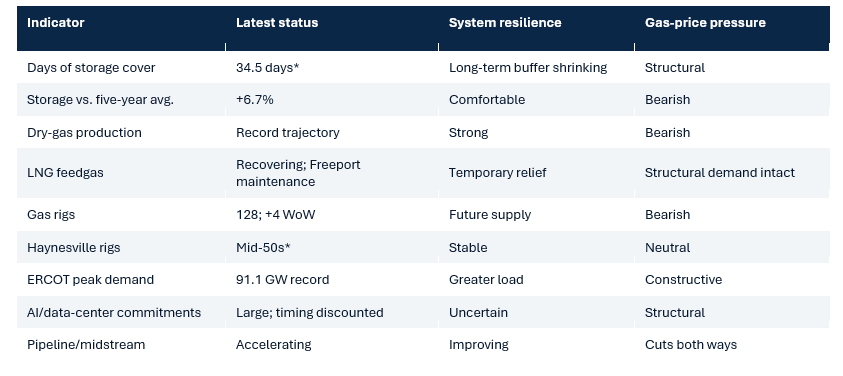
PRELIMINARY ASSESSMENT U.S. gas-system resilience is adequate today, structurally less buffered, with a strong supply and infrastructure response underway.
The system is not simply marching toward a shortage. It is adapting.
What changed the thesis this week
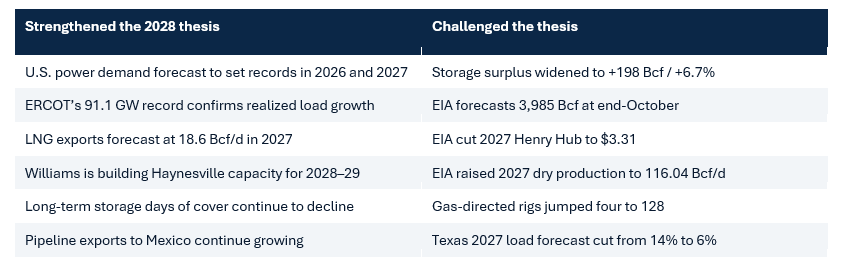
The most important new challenge was EIA’s August production forecast. A 116 Bcf/d U.S. dry-gas market in 2027 would represent a much more powerful supply response than a shortage-oriented thesis assumes.
The most important confirming evidence remains the capital committed to Haynesville infrastructure with 2028–29 service dates. Companies putting billions of dollars at risk are validating an expectation of a significantly larger Gulf Coast gas market.
Bottom line
The EnergyAlphaCo macro score declines modestly from 6.8 to 6.5—not because the long-term demand story weakened materially, but because the evidence that supply can respond strengthened.
Storage remains comfortable. Production is setting records. EIA expects another major production increase in 2027. Drilling activity rose. Permian takeaway is expanding. Haynesville pipelines are being built. Those developments make an imminent shortage less likely.
In 2010, roughly 3.84 Tcf of peak storage represented about 58 days of domestic gas demand. In 2025, 3.95 Tcf—more gas in absolute terms—represented only about 43 days.
The United States is not running out of natural gas. Its natural-gas system is becoming much larger relative to the inventory buffer that supports it.
That shifts the investment question from “Will the U.S. run out of gas?” to:
THE DEFENSIBLE QUESTION What price and level of capital investment will be required to continuously deliver enough gas to balance a substantially larger LNG, power, industrial and AI-driven market?
That remains the more defensible version of the 2028 EnergyAlphaCo natural-gas thesis.
Source framework and disclosure
Primary and market sources underlying this Scorecard include the U.S. Energy Information Administration, Baker Hughes, ERCOT, Williams, Energy Transfer, Comstock Resources and contemporaneous Henry Hub and LNG market reporting. EnergyAlphaCo calculations are identified where applicable. Preliminary market values, project schedules and forecasts may be revised.
This material is for informational and educational purposes only and does not constitute individualized investment advice. EnergyAlphaCo may discuss securities in which the author has a financial interest. Commodity prices, project schedules and company outcomes are uncertain and can change materially.