Natural Gas & LNG Scorecard
Week ended August 7, 2026. Macro assessment: 6.8/10, unchanged overall. Near-term fundamentals weakened, while several pieces of the 2028–2029 structural thesis strengthened.
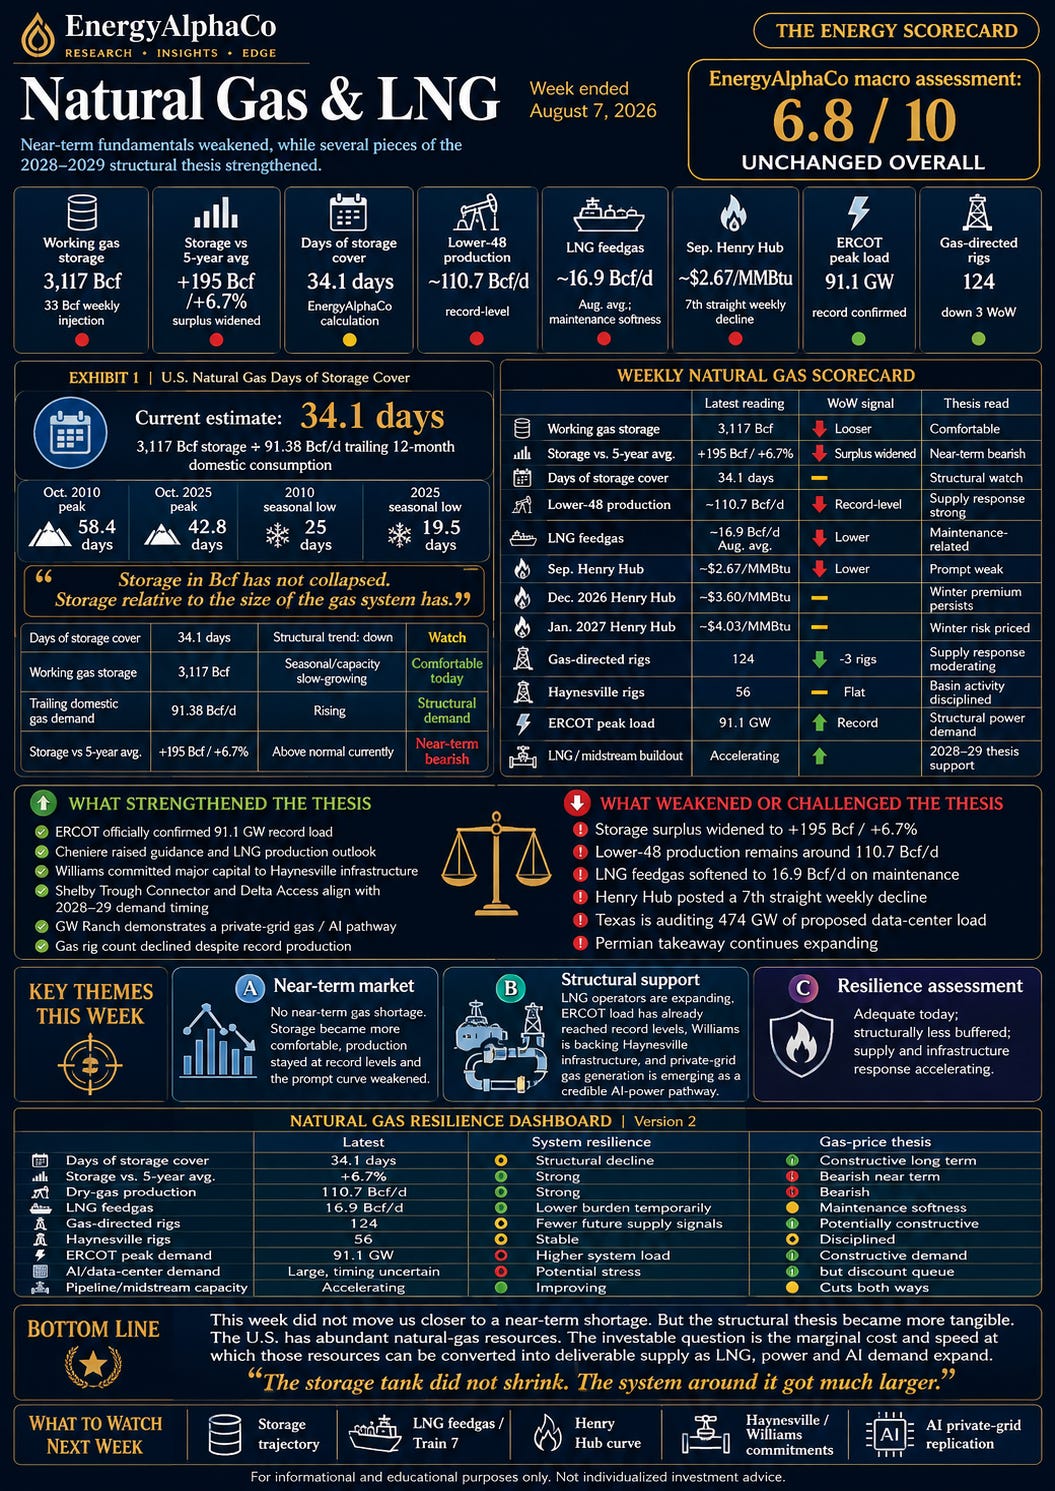
`The tension in the U.S. gas market became clearer this week. Production is still running at record levels, the storage surplus widened, LNG feedgas softened because of maintenance, and Henry Hub posted a seventh consecutive weekly decline. Yet at the same time, ERCOT’s record load was formally confirmed, Cheniere raised guidance on strong LNG demand, Williams committed billions of dollars to new Haynesville infrastructure, and private-grid gas generation for AI is moving from concept toward permitted projects.
That leaves EnergyAlphaCo in roughly the same place as last week:
There is no near-term gas shortage. The more interesting question is whether supply and infrastructure can continue scaling fast enough as the demand base becomes materially larger.
U.S. Natural Gas Days of Storage Cover
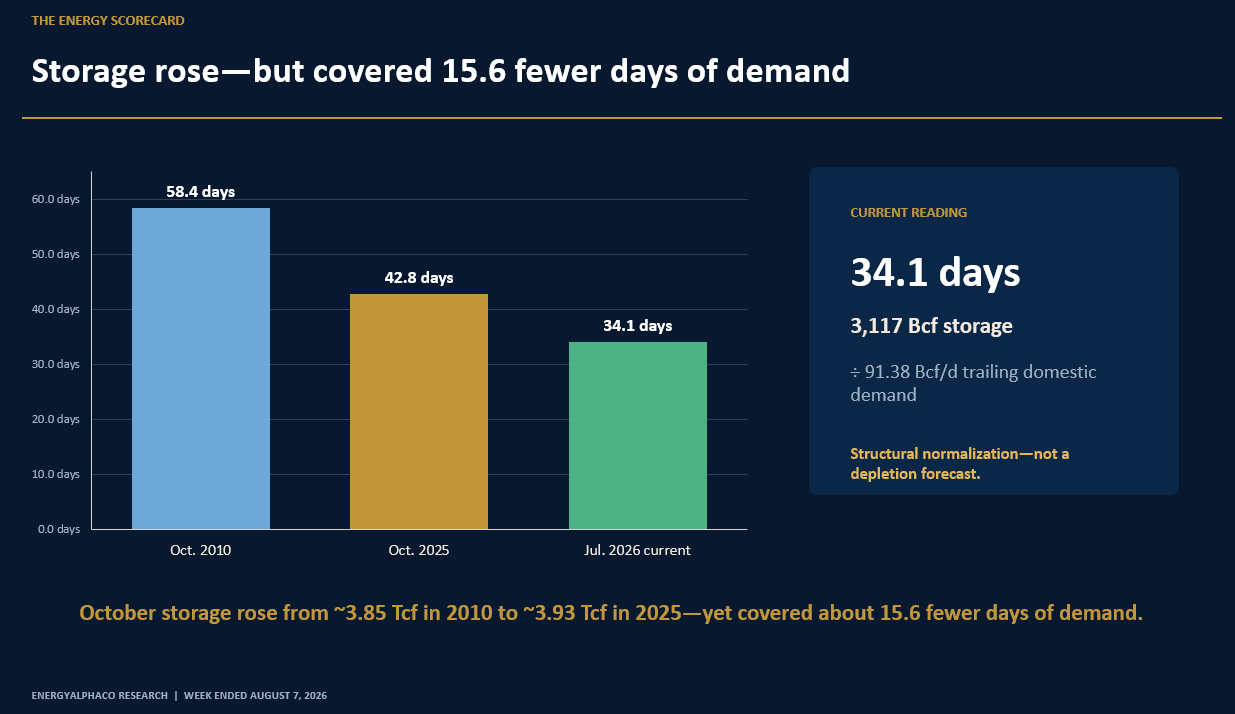
Current estimate: 34.1 days
EIA reported 3,117 Bcf of working gas in storage for the week ended July 31, after a 33 Bcf injection. Inventories were 195 Bcf above the five-year average, widening the surplus from 185 Bcf the previous week. The build was also larger than the five-year average injection of 23 Bcf for the comparable week.
For the recurring EnergyAlphaCo measure, I have now standardized the denominator as trailing 12-month U.S. total domestic natural-gas consumption. EIA monthly data for June 2025 through May 2026 total about 33.35 Tcf, or 91.38 Bcf/d on average. Dividing current storage of 3,117 Bcf by 91.38 Bcf/d produces 34.1 days of storage cover. This is an EnergyAlphaCo calculation
The historical comparison is becoming more interesting
One refinement to our original framing: the historical 55–60 day peak is really the autumn refill-season peak, not a summer peak.
Using EIA end-of-month working gas and annual average domestic consumption for a consistent historical comparison, October 2010 storage of roughly 3.85 Tcf represented about 58.4 days of average consumption. October 2025 storage was actually slightly higher at about 3.93 Tcf, yet because domestic gas consumption had grown to roughly 91.9 Bcf/d, that inventory represented only about 42.8 days of demand.
The same effect is visible at the seasonal trough. The monthly low in 2010 was roughly 1.65 Tcf, equivalent to about 25 days of average consumption. The 2025 low was about 1.79 Tcf but represented only roughly 19.5 days at the much larger contemporary demand rate. These are EnergyAlphaCo historical calculations, intended to show system scale rather than forecast depletion.
Storage in Bcf has not collapsed. Storage relative to the size of the gas system has.
Importantly, that does not imply the U.S. is running out of gas. It implies that the system has less inventory cushion relative to the demand it supports and therefore becomes more dependent on continuous production, gathering, processing, pipelines and storage deliverability.
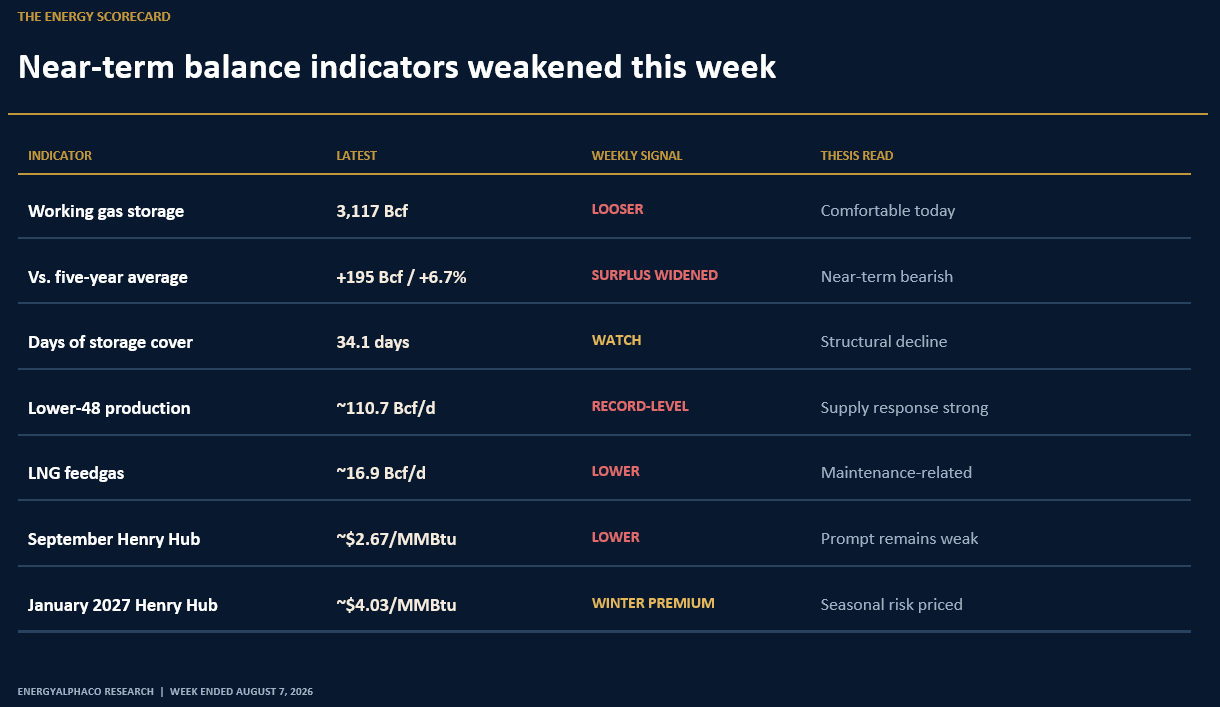
CME’s delayed August 10 snapshot showed September near $2.67, October $2.73, November $2.98, December $3.60 and January 2027 about $4.03. Baker Hughes reported 588 total U.S. rigs on August 7; gas-directed rigs fell three to 124, while Haynesville activity remained at 56 rigs
1. Storage — this week’s clearest near-term negative
The 33 Bcf build was not large in absolute terms, but it matters because it occurred during a period of strong summer electricity demand and still exceeded both consensus expectations and the comparable five-year average injection. The surplus widened to 195 Bcf, or about 6.7% above normal.
That weakens the near-term bull case. The system is proving capable of simultaneously serving high summer load and rebuilding inventories.
EIA continues to forecast approximately 3,966 Bcf of working gas by the end of October, around 5% above the five-year average. EIA expects that surplus to narrow materially during 2027 as demand grows, but it does not currently forecast a 2026 storage problem.
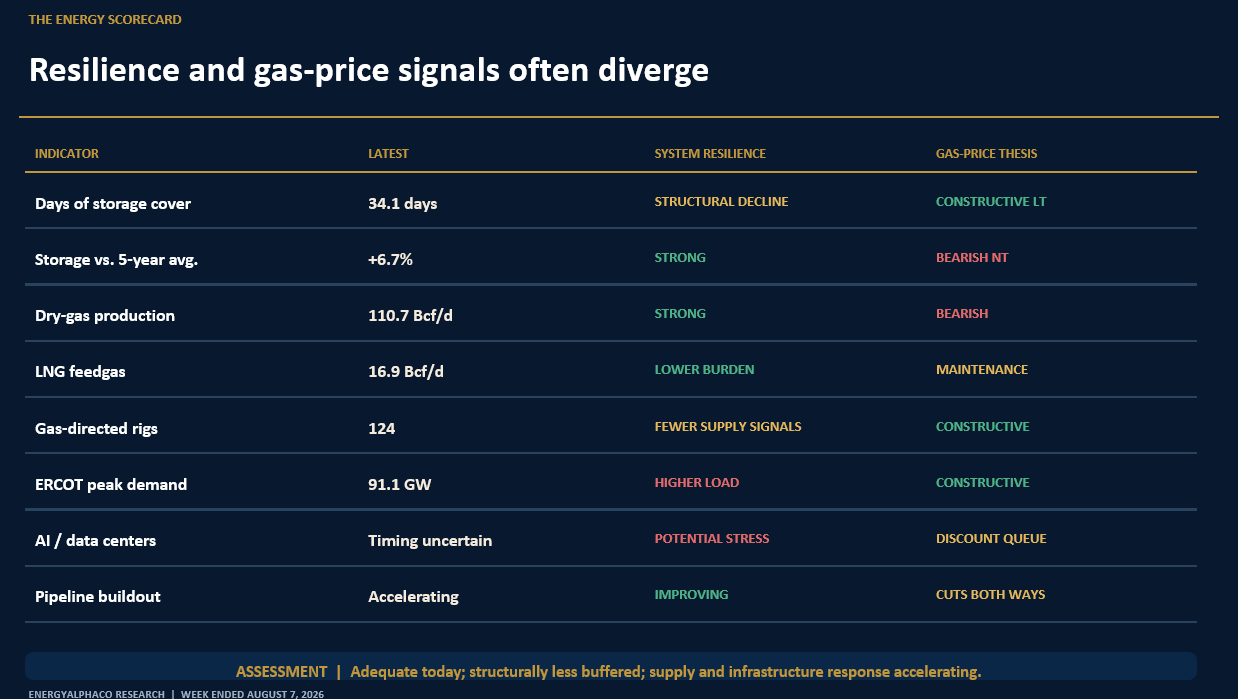
EnergyAlphaCo read: Storage is currently a bearish commodity-price indicator and a positive system-resilience indicator. That distinction will be important in the Resilience Index.
2. Henry Hub — the market still does not believe scarcity is imminent
September Henry Hub settled Friday at $2.662/MMBtu, down 3.1% for the week, its seventh consecutive weekly decline. Strong production, softer LNG feedgas and cooler weather forecasts outweighed high summer power burn.
The curve still shows meaningful winter contango. CME’s August 10 delayed quotes were approximately:

Compared with last week’s EnergyAlphaCo marks, the whole front section of the curve has softened. January remains above $4, but that is primarily a winter-risk premium rather than evidence that the market is pricing a sustained structural shortage.
EIA’s current outlook reinforces that skepticism: it forecasts average Henry Hub of $3.67 in 2026 and $3.49 in 2027, alongside record production
EnergyAlphaCo read: The futures market is effectively saying, “Show me the shortage.” Our thesis still requires evidence that the balance tightens beyond ordinary seasonal volatility.
3. Production — Matt Smith’s counterargument is working for now
Current LSEG estimates put Lower-48 production at about 110.7 Bcf/d so far in August, matching July’s monthly record. That is the single strongest argument against near-term scarcity.
EIA similarly expects annual U.S. dry-gas production to average 111.25 Bcf/d in 2026 and rise further to 115.30 Bcf/d in 2027.
This gets directly to the debate we discussed last week: how much can producers actually increase production?
The evidence so far says the industry still has considerable responsiveness. Production has risen despite sub-$3 prompt gas, largely because of productivity gains, associated gas and producers positioning ahead of LNG demand.
But there is also a subtle constructive signal in the rig count. Gas-directed rigs fell three this week to 124, while Haynesville rigs held at 56. Production is increasing without an aggressive drilling surge, which is good for today’s supply balance but raises the question of how much incremental growth can be generated from productivity before substantially more capital must enter the system.
EnergyAlphaCo read: The burden of proof remains on the structural bull. Producers are still answering demand growth. The thesis becomes materially stronger only when production growth becomes more expensive, slower or infrastructure-constrained.
4. LNG — temporary feedgas softness, structural evidence stronger
LSEG estimated LNG feedgas to the nine major U.S. export plants at about 16.9 Bcf/d so far in August, down from 17.2 Bcf/d in July and the April record of 18.8 Bcf/d. Maintenance, including work at Freeport LNG, contributed to the decline.
That is a near-term bearish signal, but I would not interpret it as thesis deterioration.
The more important development was Cheniere’s August 6 earnings update. The company raised 2026 adjusted EBITDA guidance to $7.9–$8.4 billion, exported 184 LNG cargoes in Q2, up 19.4% year over year, and expects higher exports next year as Corpus Christi expansion capacity contributes for a full year. Cheniere also raised the bottom end of its 2026 LNG production guidance to 53 million tonnes while retaining the 54-million-tonne high end.
EIA currently forecasts U.S. LNG exports averaging 17.4 Bcf/d in 2026 and 18.6 Bcf/d in 2027, versus 15.1 Bcf/d in 2025.
EnergyAlphaCo read: Maintenance noise is temporary. The contractual and physical LNG capacity buildout remains intact.
5. Power demand — ERCOT moved from forecast to observed evidence
EIA formally confirmed that ERCOT load reached a record 91.1 GW on July 22, 6% above the previous record of 85.5 GW from 2023. At the 6 p.m. peak, natural gas supplied 48% of generation and solar supplied 32%.
That is important because it shifts part of the demand thesis from forecast to observation.
EIA now expects U.S. gas consumption in the electric-power sector to rise 2% in 2026 and another 4% in 2027, reaching 38.1 Bcf/d on an annual basis in 2027. It projects monthly gas burn could reach 50.6 Bcf/d in July 2027, which would be a record.
Solar is clearly absorbing substantial incremental load, so the thesis cannot assume every new megawatt becomes gas demand. But a much larger grid can simultaneously add massive renewable generation and require more dispatchable gas generation.
6. AI demand — a new and important thesis risk appeared this week
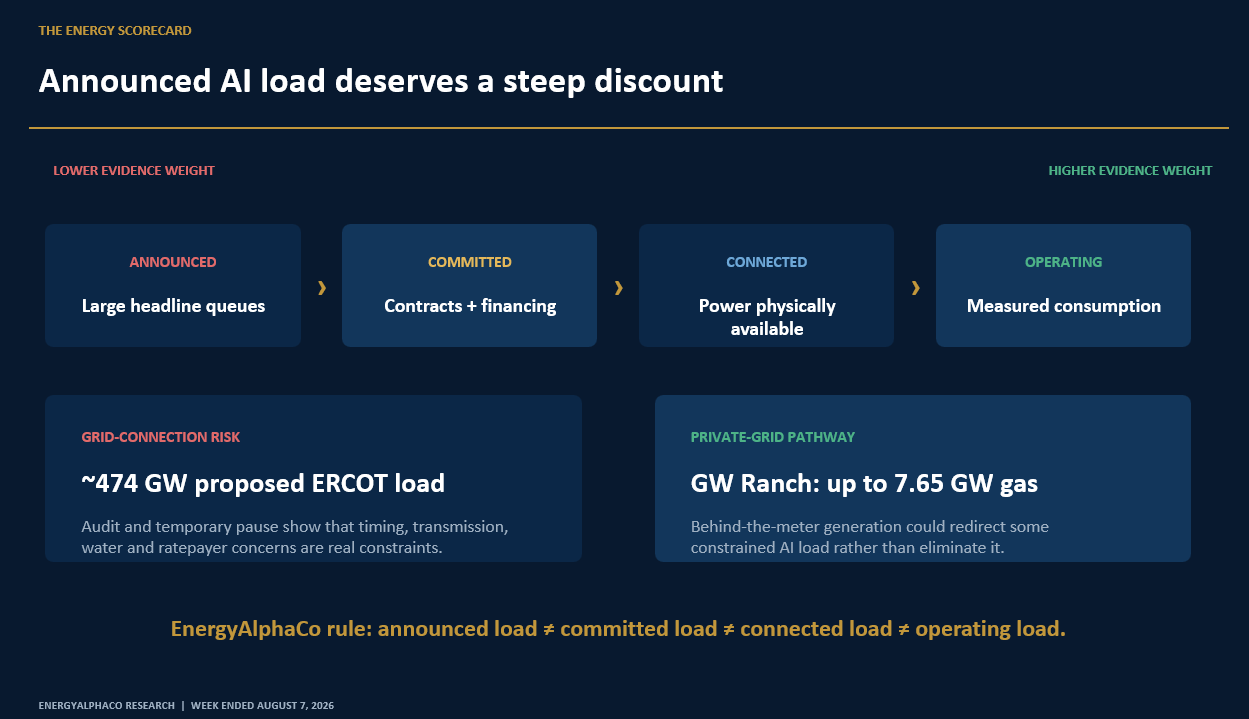
Texas Governor Greg Abbott ordered an audit and temporary pause on approvals of new data-center projects seeking ERCOT grid connections. ERCOT is reviewing approximately 474 GW of proposed new load, about 90% attributed to data centers and more than five times the state’s current peak demand.
This deserves to be treated as a real thesis-risk signal, not dismissed.
The obvious implication is that not every hyperscale project currently in the queue will be built on its advertised schedule. Political opposition, transmission availability, water requirements and ratepayer concerns are becoming part of the demand forecast.
But there is an interesting second-order effect.
Pacifico Energy’s GW Ranch in West Texas is explicitly designed as a private-grid hyperscale campus. Pacifico has approval for up to 7.65 GW of gas generation, says the campus can provide more than 5 GW of dedicated power, targets first power in Q1 2027, 1 GW online during 2028 and 5+ GW by 2031, and does not require an ERCOT grid connection.
That means Texas grid restrictions could potentially push some AI development toward behind-the-meter gas generation rather than eliminate the load altogether. That is an EnergyAlphaCo inference, not a confirmed outcome.
EnergyAlphaCo read: AI demand remains highly constructive, but we should discount announced grid-connected projects more aggressively. Permitted private-grid projects deserve a higher evidence weighting.
This is exactly the kind of distinction the News Pulse framework should continue making: announced load ≠ committed load ≠ connected load ≠ operating load.
7. Haynesville and midstream — perhaps the most important structural development this week
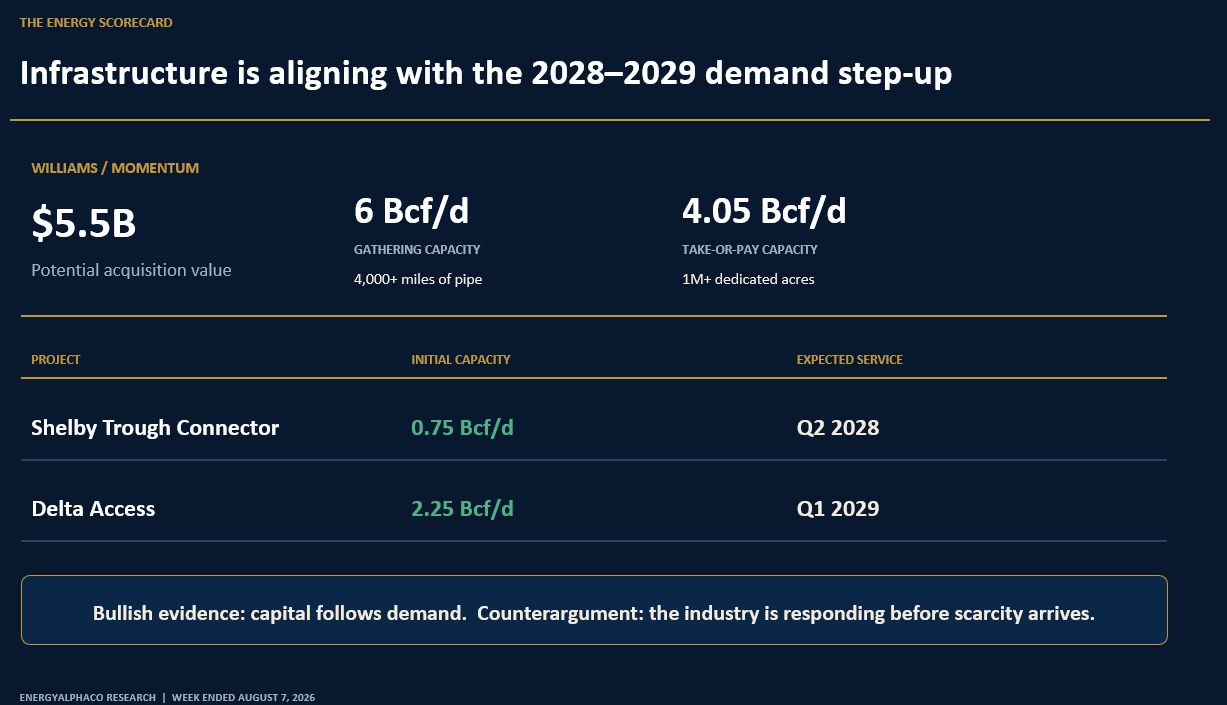
Williams announced a deal to acquire Momentum Midstream for up to $5.5 billion, dramatically expanding its Haynesville footprint. Momentum adds more than 4,000 miles of pipe, over 1 million dedicated acres, 6 Bcf/d of gathering capacity and 4.05 Bcf/d of take-or-pay pipeline capacity.
More importantly, Williams simultaneously announced two new expansion projects:
Shelby can ultimately expand to 1.5 Bcf/d. Williams explicitly tied the projects to growing Gulf Coast LNG and power demand.
This is exceptionally relevant to the 2028 EnergyAlphaCo thesis because infrastructure capital is now being committed on roughly the same timetable as the demand step-up we have been monitoring.
There are two interpretations, and both matter.
Bullish thesis interpretation: sophisticated midstream operators are committing billions because they see enough Haynesville production, LNG demand and power demand to justify substantial new infrastructure.
Bearish/scarcity-counterargument: the industry is responding. New pipes increase deliverability and can prevent infrastructure scarcity from becoming commodity scarcity.
That tension is exactly the right way to frame the thesis.
8. Permian takeaway — another supply response to watch
Energy Transfer’s Hugh Brinson Pipeline is designed to move 1.5 Bcf/d initially from the Permian toward East Texas, with eventual eastbound capacity of approximately 2.2 Bcf/d. Energy Transfer currently targets Phase I by the end of 2026 and Phase II in early 2027.
For Henry Hub, that is a near-term bearish development because it releases additional associated gas that has historically been trapped at Waha.
For system resilience, it is constructive.
For dry-gas producers such as CRK, it increases the importance of having genuinely superior well economics rather than relying solely on Gulf Coast demand growth.
9. Comstock Resources — the week’s developments cut both ways
There was no need for another full CRK earnings rehash this week. The more important question is how the macro developments alter the thesis.
The negative side is straightforward: prompt Henry Hub is weaker, U.S. production remains at record levels, inventories are 6.7% above normal, and additional Permian gas will gain access to East Texas markets.
The constructive side is more strategically important. Williams is investing directly into the Haynesville/Shelby Trough corridor with new capacity scheduled for 2028–29, exactly when LNG and power demand are expected to be substantially larger. CRK is also adding activity in the Western Haynesville as it attempts to prove that acreage can become a scalable source of incremental supply.
For CRK shareholders, the thesis should therefore remain:
Higher gas demand is necessary—but not sufficient. CRK must prove that Western Haynesville gas can be developed economically enough that higher commodity value survives drilling costs, infrastructure spending, leverage and dilution and reaches shareholders on a fully diluted per-share basis.
The Williams announcement is particularly useful evidence because it reduces one potential future thesis breaker—insufficient takeaway—but simultaneously raises the bar on the scarcity thesis because infrastructure is clearly responding.
For other gas-sensitive producers such as EQT, Expand Energy, Range and Antero, the same basic setup persists: weak prompt prices constrain immediate FCF upside, while the longer-term value rests on whether 2027–29 demand growth moves the durable forward strip higher rather than merely producing temporary winter spikes.
Bottom line
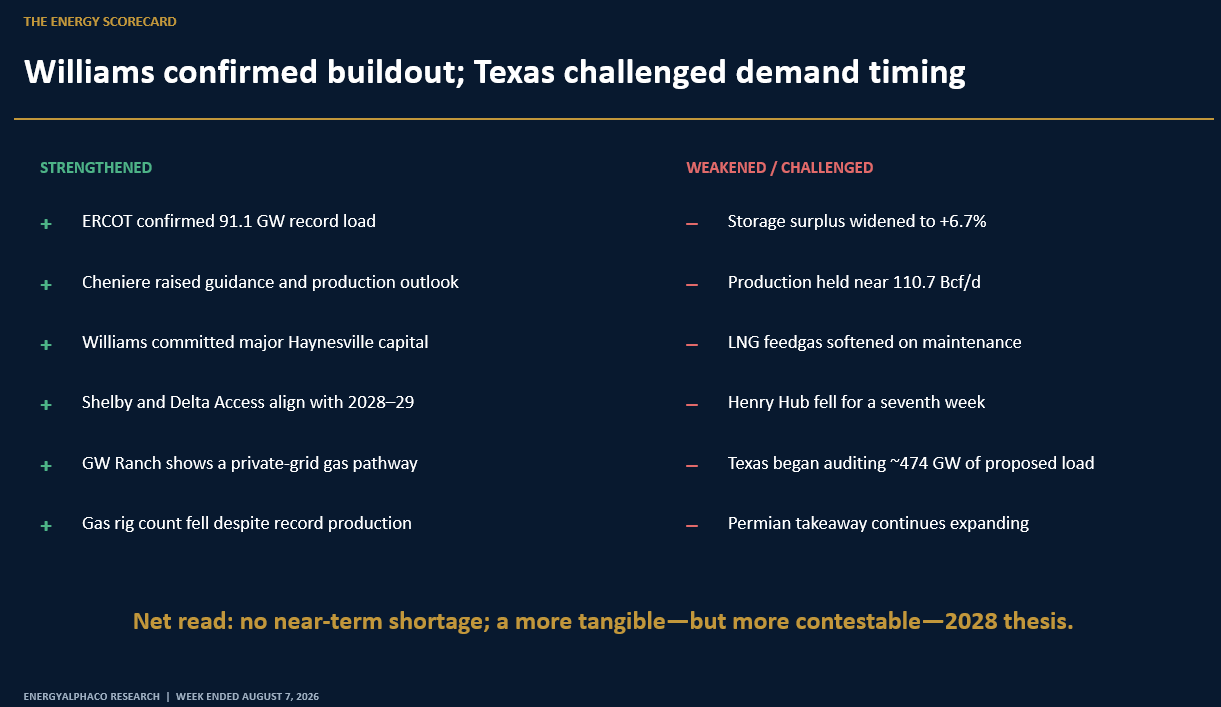
This week did not move us closer to a near-term shortage.
If anything, the opposite occurred. Storage became more comfortable relative to the five-year average, production stayed at record levels and the prompt curve weakened.
But the structural thesis also became more tangible.
LNG operators are producing and expanding. ERCOT load has already reached levels that looked aggressive only a few years ago. Williams is putting billions behind Haynesville infrastructure targeted for 2028–29. Private-grid gas generation is emerging as a credible answer to grid-constrained AI development.
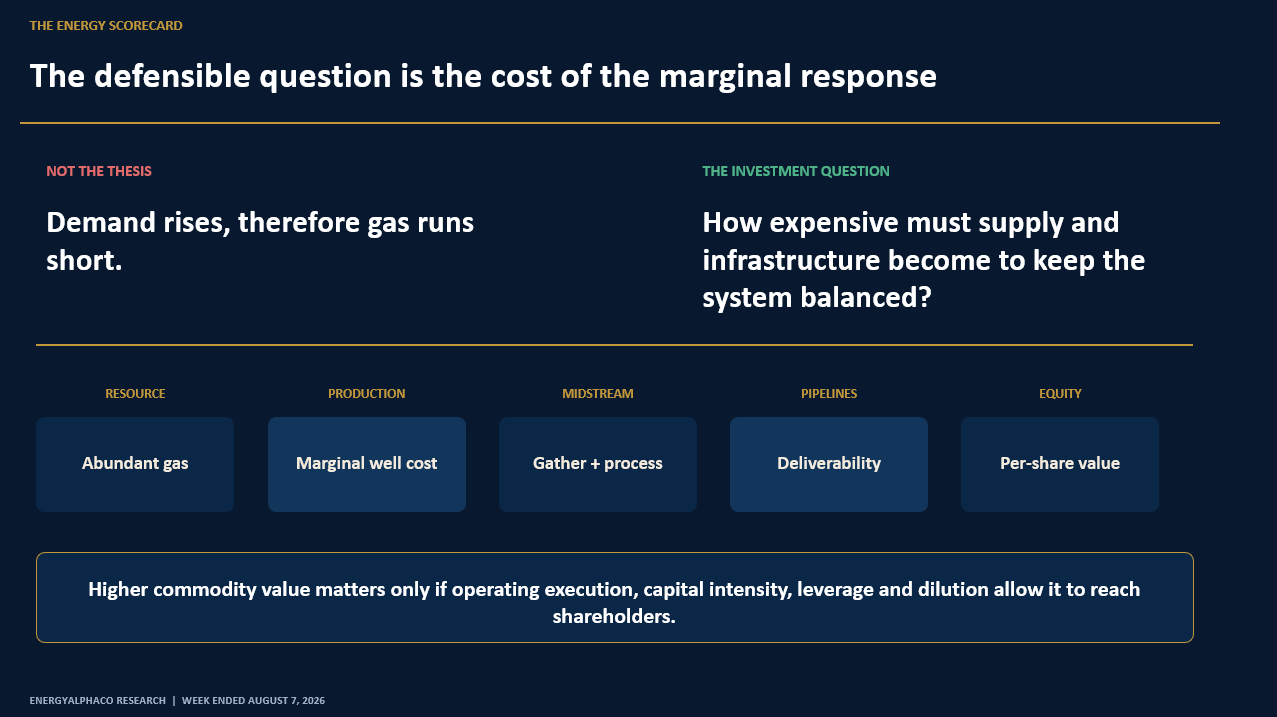
The result is a more nuanced—but stronger—EnergyAlphaCo framework:
The U.S. has abundant natural gas resources. The investment question is the marginal cost and speed at which those resources can be converted into deliverable supply as LNG, power and AI demand expand.