
Natural Gas & LNG Scorecard
Week ended July 31, 2026. MACRO ASSESSMENT 6.8 / 10 Structurally constructive

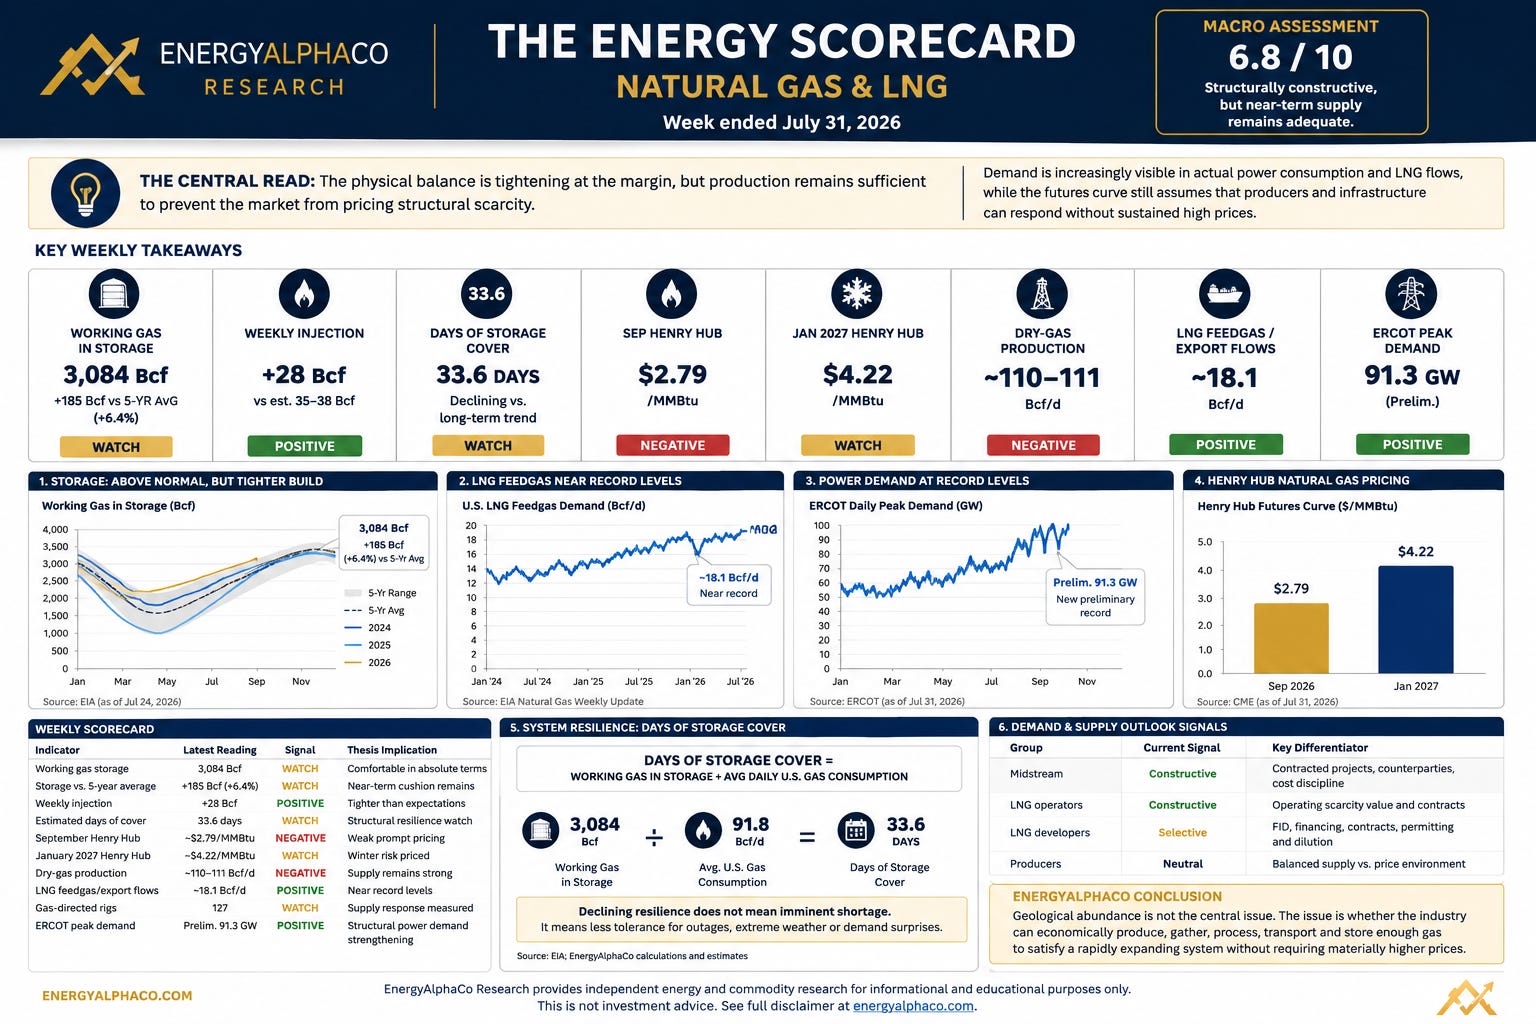
The most important development this week was not the absolute storage level. It was the combination of a smaller-than-expected 28 Bcf injection, continued record-level power demand, LNG feedgas near 18 Bcf/d and a prompt Henry Hub contract still below $3/MMBtu.
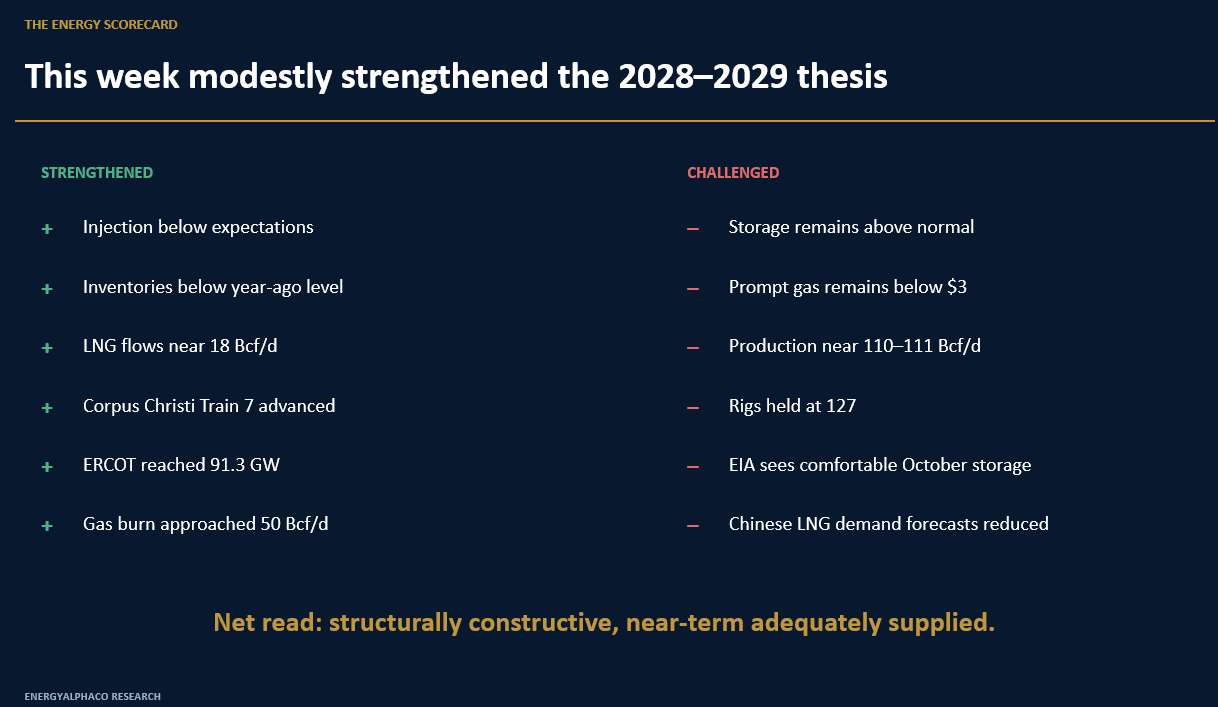
The EnergyAlphaCo 2028–2029 thesis strengthened modestly this week. Demand is increasingly visible in actual power consumption and LNG flows, while the futures curve still assumes that producers and infrastructure can respond without sustained high prices.
Executive summary
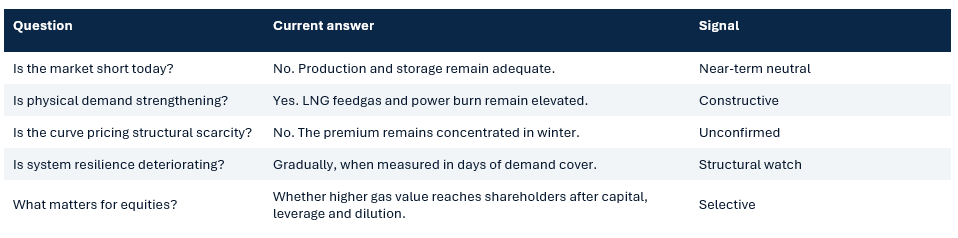
The latest evidence strengthens the view that U.S. natural-gas demand is entering a structurally higher phase, but it does not yet confirm an impending shortage. Storage remains above normal, dry-gas production remains near record levels and prompt pricing remains weak. At the same time, record power loads, LNG commissioning and a tighter-than-expected weekly storage build indicate that the system’s demand base is expanding faster than absolute inventory comparisons alone reveal.

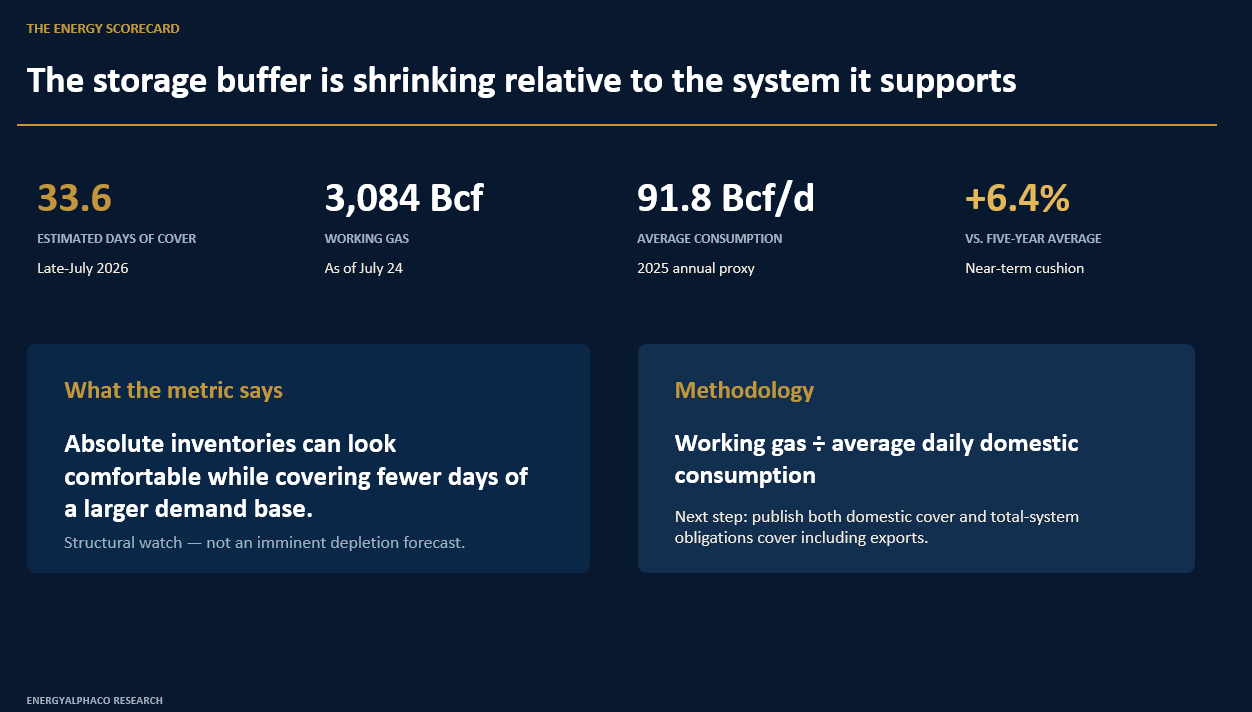
The storage buffer is shrinking relative to the system it supports
EnergyAlphaCo’s Days of Storage Cover metric divides current working-gas inventories by the trailing average rate of U.S. natural-gas consumption:
FORMULA Days of storage cover = working gas in storage ÷ average daily U.S. gas consumption
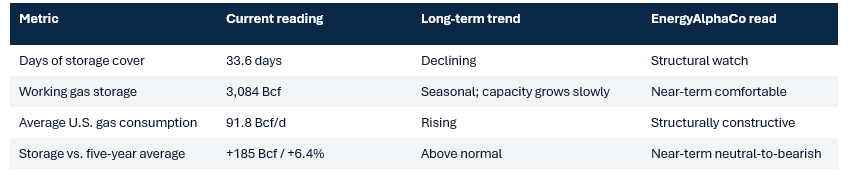
The estimate uses 3,084 Bcf of working gas as of July 24, 2026 and approximately 33.5 Tcf of 2025 U.S. consumption, or roughly 91.8 Bcf/d. It is a structural normalization measure—not a forecast that storage could or would actually be depleted in 33.6 days.
Methodology qualification
The 33.6-day reading uses the latest complete annual EIA consumption figure as the denominator. Future editions should replace this proxy with a rolling trailing-12-month calculation as monthly data become available.
The current metric measures domestic consumption, including lease and plant fuel and pipeline and distribution use. It does not add LNG and pipeline exports. EnergyAlphaCo should eventually publish both domestic-consumption cover and total-system-obligations cover, including exports, to prevent methodological confusion.
Why it matters
Absolute storage can appear comfortable even as the effective system buffer declines. A larger gas market must serve higher power-sector consumption, growing LNG exports, pipeline exports to Mexico, industrial demand and increasingly concentrated infrastructure loads.

Source: Energy Information Administration storage and annual consumption data; EnergyAlphaCo calculations.
Weekly scorecard
1. Storage: the surplus remains, but the latest build was tight
Verified facts
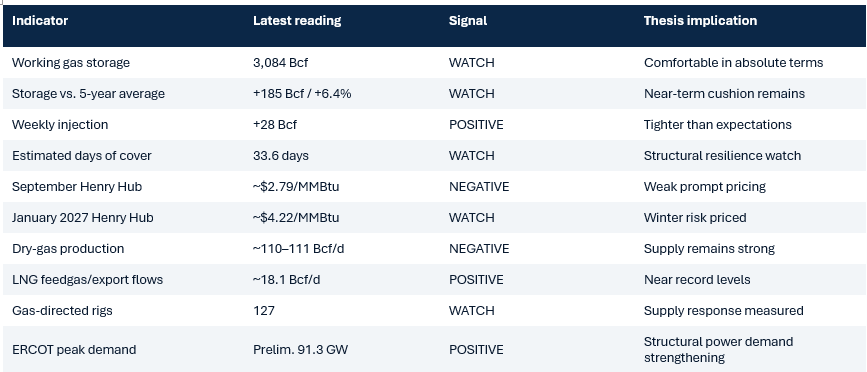
EIA reported 3,084 Bcf of working gas in storage for the week ended July 24, following a 28 Bcf injection. Inventories were 185 Bcf above the five-year average, 6.4% above normal and 32 Bcf below the comparable level one year earlier. The build was below market expectations of approximately 35–38 Bcf.
EnergyAlphaCo interpretation — modestly constructive
The market remains adequately supplied, but the report was tighter than the headline surplus suggests. One weekly report does not establish a structural change. The more meaningful signal would be several consecutive weather-adjusted injections below expectations.
2. Henry Hub and the forward curve
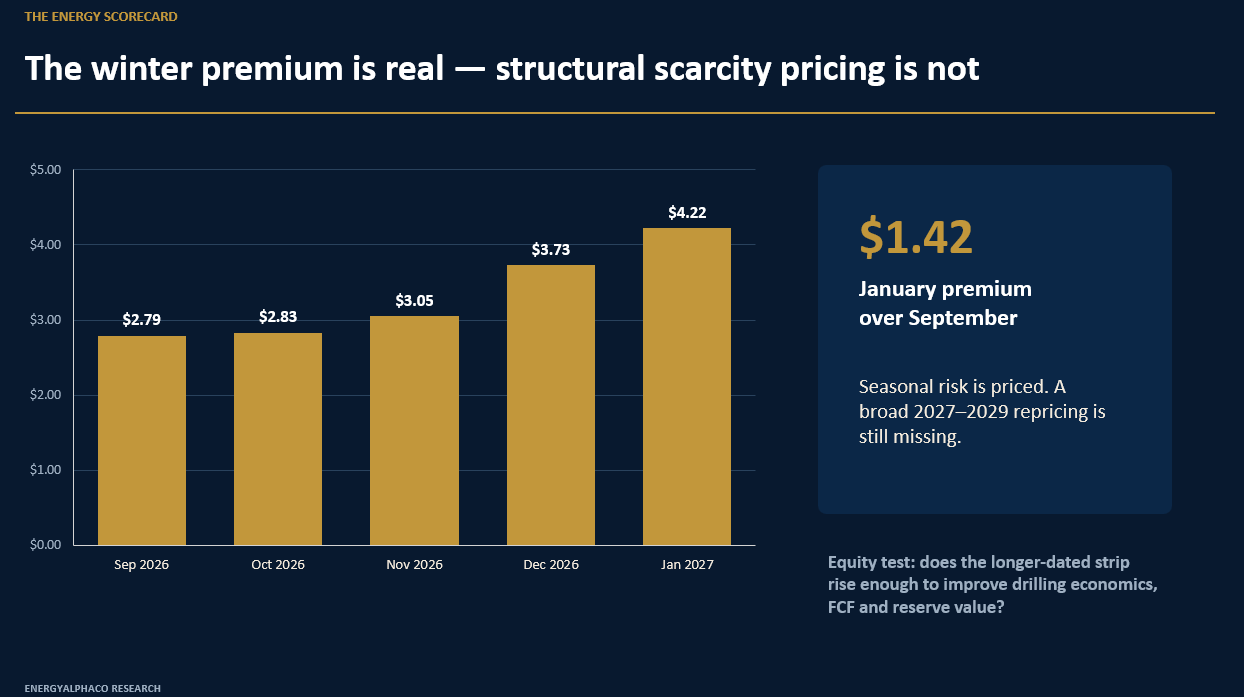
The curve prices a well-supplied late summer and shoulder season, followed by a significant winter premium. January trades roughly $1.42/MMBtu above September. That reflects seasonal risk rather than a broad structural repricing.

For gas-sensitive equities, the important test is not whether one winter contract reaches $4. It is whether the 2027–2029 strip rises enough to improve drilling economics, free-cash-flow expectations and reserve values.
Source: CME Henry Hub futures quotes and July 31, 2026 market reporting.
3. Dry-gas production
Industry estimates placed recent Lower-48 dry-gas production around 110–111 Bcf/d. EIA’s latest monthly data showed gross U.S. gas production declining from 135.3 Bcf/d in April to 134.0 Bcf/d in May; gross and dry production are not directly comparable.
EnergyAlphaCo interpretation — near-term bearish
Production remains the principal reason that record power demand and high LNG exports have not produced materially higher prompt prices. Producers can almost certainly increase output at higher prices. The central question is how much additional deliverable production can be added, at what price, with how much capital and how quickly gathering, processing and pipeline systems can accommodate it.
Doomberg expects higher prices to reveal additional supply and political responses.
Matthew Smith’s thesis places greater weight on inventory, decline rates and infrastructure constraints.
EnergyAlphaCo’s current view: output can rise materially, but cost and response time may increase as practical deliverability limits approach.
4. LNG feedgas and project developments
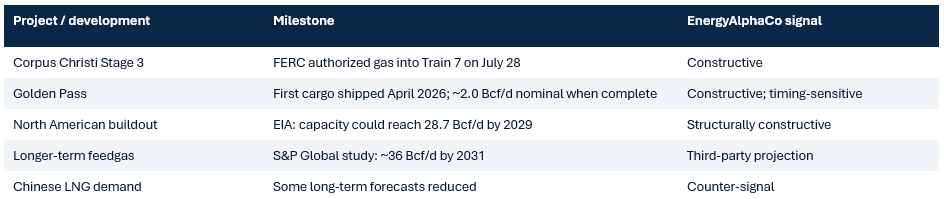
U.S. LNG export flows were recently estimated near 18.1 Bcf/d, alongside approximately 8.4 Bcf/d of pipeline exports to Mexico. LNG demand is close to current peak export capacity and well above levels that prevailed only several years ago.

Source: FERC, EIA project schedules and industry flow estimates; S&P Global study cited as a third-party projection.
5. Power-sector demand
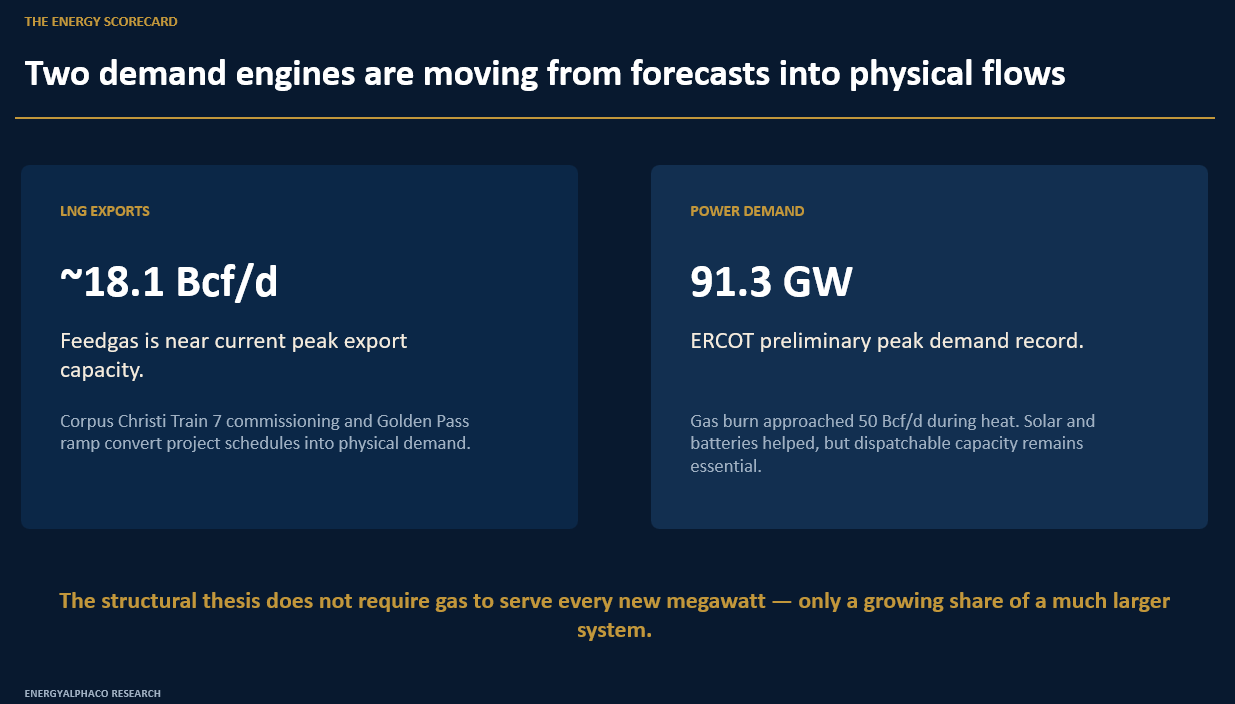
ERCOT reached a preliminary peak of approximately 91,308 MW on July 22, exceeding the prior-day record of 87,403 MW and the previous 2023 record of 85,508 MW. Gas-fired power demand across the United States was recently estimated near 49.5 Bcf/d during the heat wave.
Solar and batteries contributed materially during the peak. The gas thesis does not require every incremental megawatt to be supplied by gas. It requires total load to grow rapidly, dispatchable capacity to remain necessary, gas generation to rise annually and data-center and industrial loads to increase demand outside traditional peak periods.

Source: ERCOT preliminary operating data; DOE emergency order; industry gas-burn estimates.
6. Rig activity and supply response
The total U.S. rig count increased by one to 588 for the week ended July 31: 451 oil rigs, 127 gas rigs and 10 miscellaneous rigs. The gas-directed count was unchanged.
EnergyAlphaCo interpretation — neutral
A 127-rig gas count indicates that producers are preparing for demand growth, but it does not resemble a disorderly supply response. Rig counts are incomplete because laterals are longer, drilling efficiency changes, productivity varies by basin, private-company activity matters and associated gas can grow without gas-directed rigs.
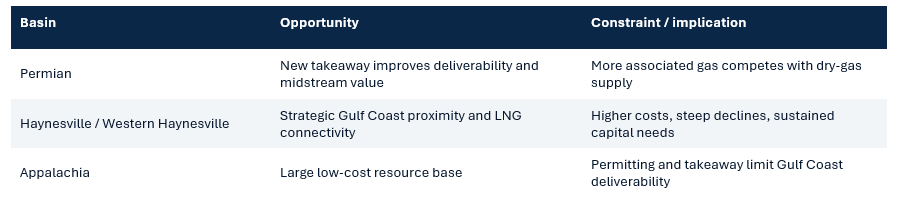
7. Basin and pipeline constraints

8. Comstock Resources: operating case strengthened; balance-sheet case unproven
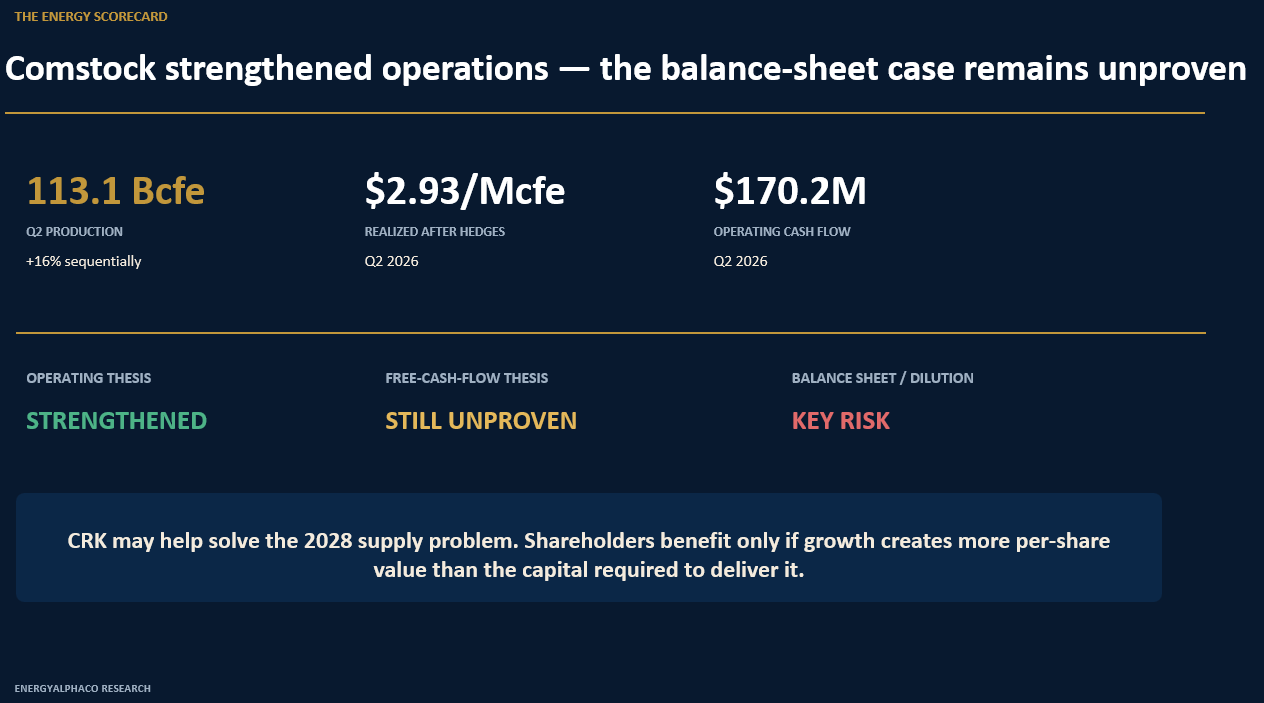
First-half capital expenditures materially exceeded operating cash flow, reinforcing that CRK remains in an investment and inventory-development phase rather than a harvest phase.
The 16% sequential production increase demonstrates that Comstock can add meaningful volumes. But shareholders benefit only if CRK reduces Western Haynesville costs, replicates strong wells, funds growth without excessive debt or dilution and converts higher future gas prices into fully diluted per-share free cash flow.
Source: Comstock Resources Q2 2026 results and recent SEC filing data.
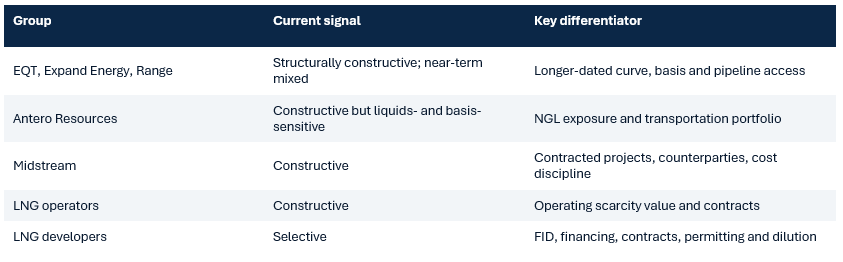
9. Other gas-sensitive equities
10. Natural Gas Resilience Dashboard — initial version
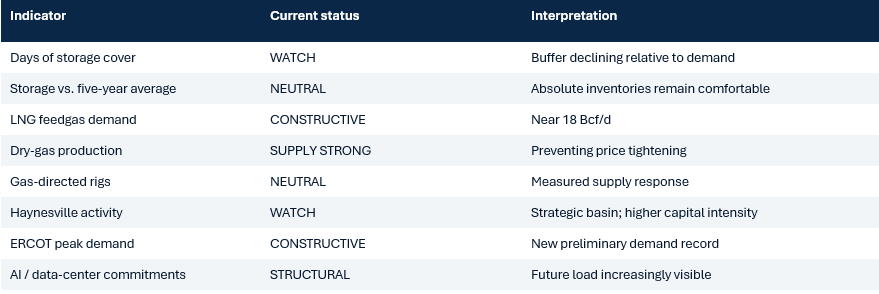
Preliminary resilience assessment

The system is not in shortage: inventories are above average, production is near record levels, pipeline capacity is expanding and a drilling response is visible. But it is also larger, more export-dependent, more power-demand intensive, more reliant on uninterrupted infrastructure and less buffered in days-of-cover terms.
What changed this week
Bottom line
The latest evidence strengthens the view that U.S. gas demand is entering a structurally higher phase, but it does not confirm an impending shortage. The near-term market remains adequately supplied because production is strong and storage is above normal. Declining days of cover shows why absolute storage alone is becoming a less complete measure of resilience.

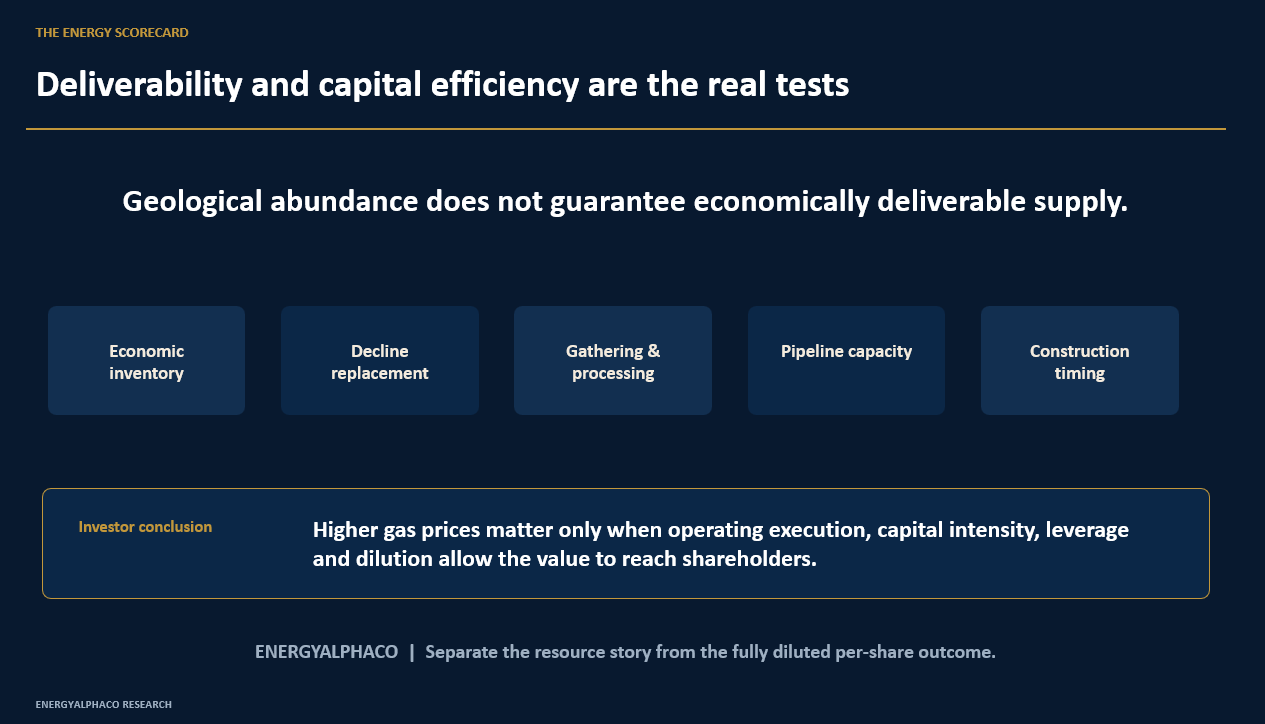
For Comstock and other gas-sensitive producers, that creates potential upside—but only where operating execution, capital intensity, leverage and dilution allow higher commodity value to reach shareholders on a fully diluted per-share basis.
Source framework and disclosures
Primary and market sources used in the underlying scorecard include the U.S. Energy Information Administration, Federal Energy Regulatory Commission, ERCOT, U.S. Department of Energy, Baker Hughes, CME Henry Hub futures data, Comstock Resources filings and earnings materials, and cited industry flow estimates. S&P Global’s 2031 feedgas estimate is identified as a third-party projection. Preliminary values and market quotes may be revised.
This material is for informational and educational purposes only and does not constitute individualized investment advice. EnergyAlphaCo may discuss securities in which the author has a financial interest. Commodity prices, project schedules and company outcomes are uncertain and can change materially.