
How to Read an E&P Earnings Release
A practical framework for separating operational performance, commodity effects and genuine per-share value creation.
FRAMEWORK ARTICLES / INVESTOR EDUCATION

Investment-learning conclusion
The best quarter is not necessarily the one with the highest production, the largest adjusted EBITDA figure or the most upbeat headline. A strong E&P quarter is one in which the company converts its asset base and commodity exposure into durable, fully diluted per-share value—while preserving or improving the balance sheet.
Why this matters
Exploration-and-production earnings releases are unusually easy to misread. Revenue and profit can swing with oil and natural-gas prices even when field execution has barely changed. Production can rise because of an acquisition rather than better wells. Free cash flow can improve because capital spending was deferred. A company can report record volumes while issuing shares, adding debt or consuming inventory faster than investors realize.
Management presentations are designed to explain the quarter in the most constructive light. That is not improper, but it means investors must perform their own reconciliation: what changed because of commodity prices, what changed because of operations, what changed because of financing, and what changed on a per-share basis?

The common mistake: starting with the headline
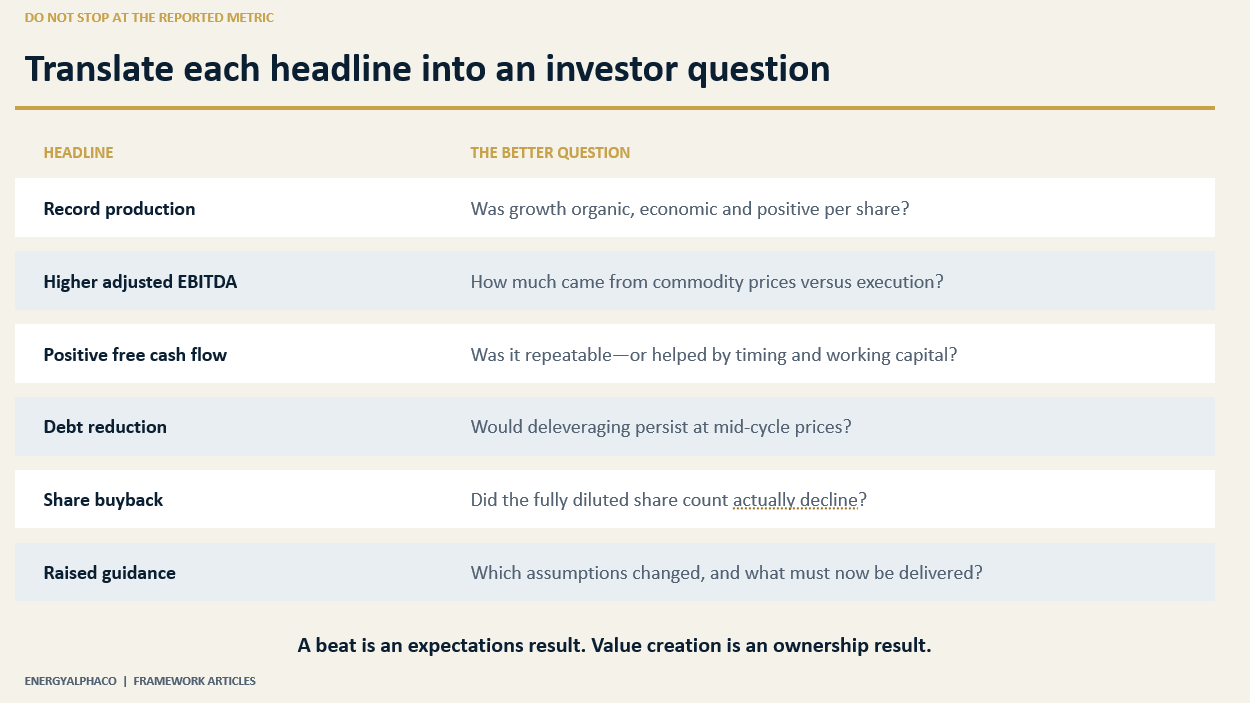
The headline usually emphasizes one or more of the following: record production, adjusted EBITDA, adjusted earnings, free cash flow, a dividend or buyback, lower costs, or raised guidance. Each may be useful. None is sufficient by itself.
Adjusted EBITDA can rise because commodity prices rose, even if unit costs or well performance deteriorated.
Production growth can come from an acquisition, a high capital budget or faster inventory consumption.
Free cash flow can look strong when drilling or completion activity is pushed into the next quarter.
A buyback can be offset by stock compensation, acquisition shares, warrants or convertible securities.
A guidance “raise” may reflect higher commodity prices or an acquired asset rather than better execution.
The better approach is to read the release in a fixed sequence. This prevents management’s preferred metric—or the market’s initial reaction—from setting your analytical frame.
The better framework: a nine-step reading sequence
A disciplined earnings review should follow the economics of the business rather than the order in which management presents the results. Start with what the company produced, determine what it actually received after hedges and basis differentials, examine the costs and capital required to sustain those volumes, and then reconcile the result to free cash flow, debt and fully diluted per-share value.
The following nine-step sequence provides a repeatable framework for moving from operating performance to the outcome that ultimately matters for shareholders.
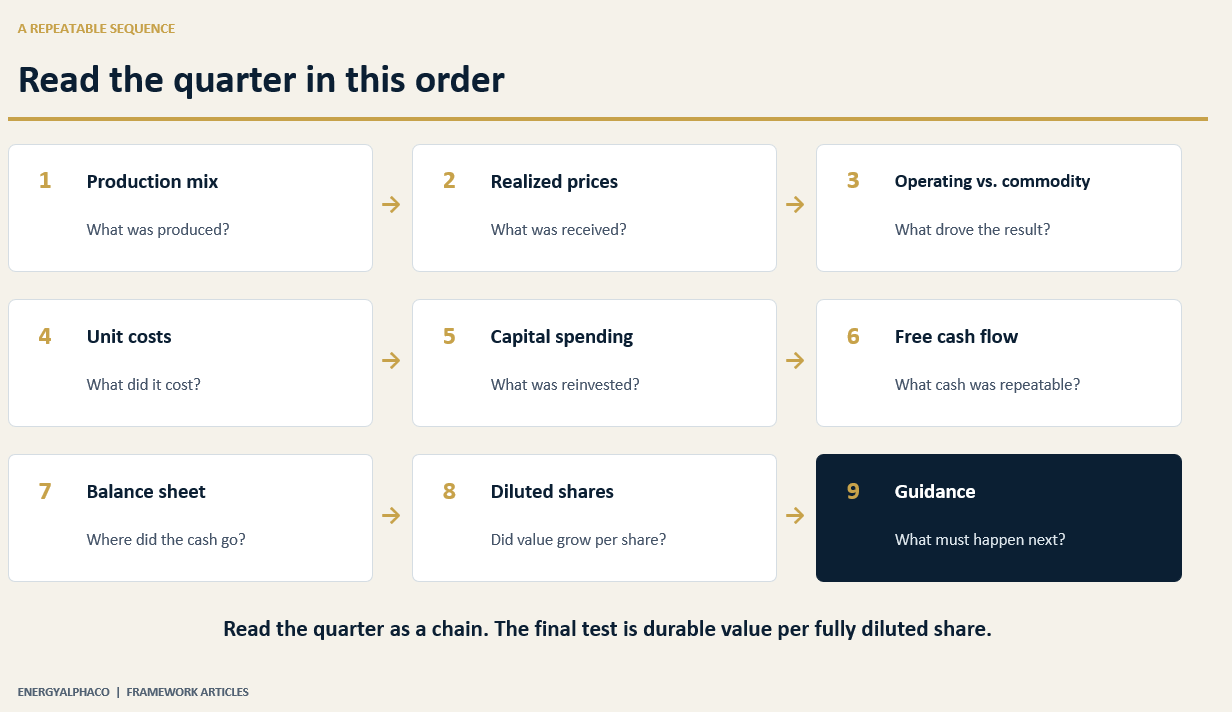
Start with the production mix—not just total production. Separate oil, natural gas and natural-gas liquids. A barrel of oil equivalent is a conversion convention, not a statement of economic equivalence. The commodity mix determines revenue, margins and sensitivity. Compare reported volumes with prior-quarter results and guidance, then ask whether the change was organic, acquisition-driven, divestiture-related or weather-related.
Reconcile benchmark prices to realized prices. Henry Hub, WTI and Brent are reference prices—not necessarily the prices the company received. Examine regional basis differentials, quality adjustments, transportation deductions, natural-gas-liquid pricing and hedge settlements. The realized-price bridge often explains more than the production headline.
Separate operational performance from commodity effects. Ask what the quarter would have looked like at unchanged commodity prices. Higher prices can mask rising lease operating expense, weaker well productivity or unfavorable differentials. Lower prices can obscure genuine efficiency gains. Investors should judge both the asset performance and the commodity environment, but not confuse the two.
Test costs on a unit basis. Review lease operating expense, gathering and transportation, production taxes, cash general and administrative expense, and interest expense. Total costs often rise with acquisitions or production; per-unit costs reveal whether the underlying operation became more or less efficient. Also check whether a favorable quarter reflects timing, reimbursements or unusual credits.
Reconstruct capital spending. Compare actual capital expenditures with guidance and with the activity delivered: wells drilled, wells completed, lateral footage, facilities and infrastructure. Distinguish maintenance capital—the spending required to sustain production—from growth capital. Companies rarely report maintenance capital as an audited figure, so treat management estimates as assumptions to test, not facts.
Rebuild free cash flow. Start with cash flow from operations, identify working-capital movements, subtract capital expenditures and exclude asset-sale proceeds or other financing-like items. Then ask whether the result is repeatable. A quarter can produce cash because payables increased, receivables fell, activity slowed or spending shifted between periods.
Follow the cash into the balance sheet. Free cash flow should have a destination: debt reduction, dividends, buybacks, acquisitions or cash accumulation. Compare net debt with the prior quarter and review revolver borrowings, maturities, interest rates and liquidity. If reported free cash flow was substantial but net debt barely moved, determine where the cash went.
Check the fully diluted share count. Compare weighted-average diluted shares, period-end basic shares and the potential impact of equity awards, warrants, convertibles and acquisition consideration. A company can grow production and enterprise value while creating little value per share. Repurchase announcements matter less than the net change in ownership per share.
Read guidance as a range of implied outcomes. Do not stop at “raised,” “maintained” or “lowered.” Identify which components changed: volumes by commodity, capital spending, unit costs, differentials, taxes, interest or completion timing. Calculate the midpoint change, but also examine the shape of the range and what must occur in the remaining quarters to achieve it.
The earnings-quality bridge
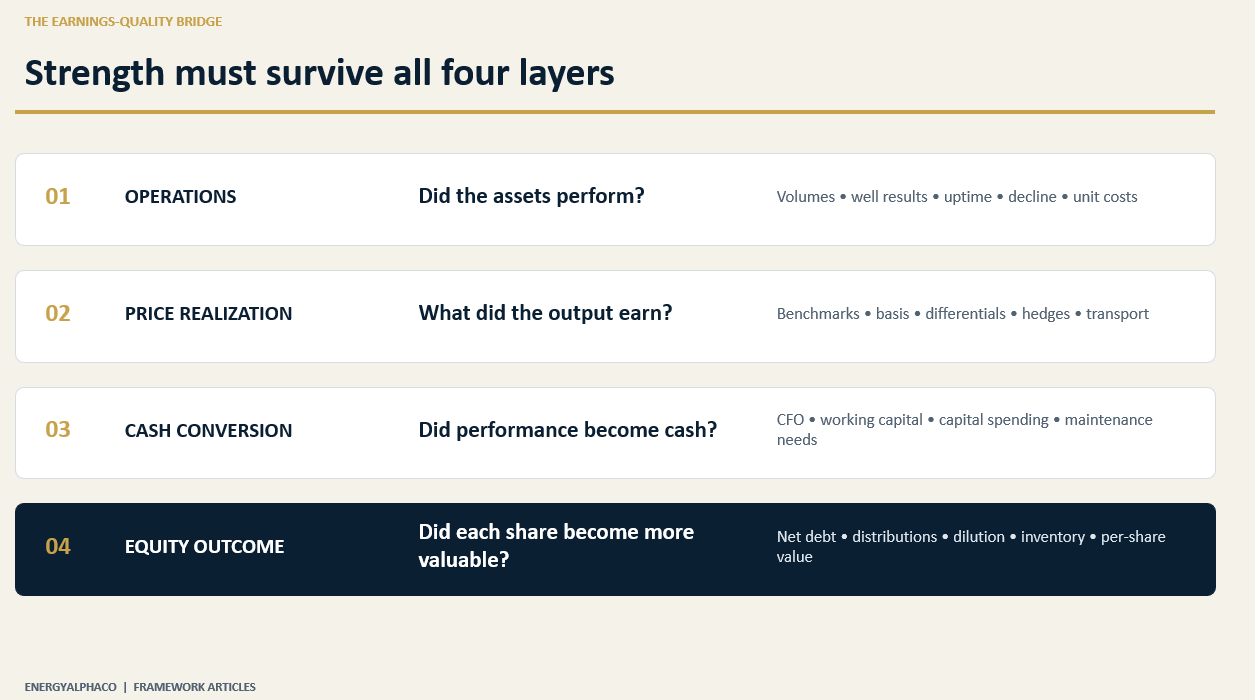
A useful mental model is to trace the quarter through four layers. Each layer answers a different question, and strength at one layer does not guarantee strength at the next.
A simplified E&P example
Consider a hypothetical producer that reports record production, higher adjusted EBITDA and positive free cash flow. The headline sounds strong. A disciplined reading might uncover the following:
Total production increased 12%, but most of the increase came from an acquisition financed partly with shares and debt.
Oil production was flat, while lower-value natural-gas volumes drove the reported barrel-of-oil-equivalent growth.
Realized gas pricing benefited from favorable hedge settlements, so the quarter does not represent the company’s future unhedged sensitivity.
Capital spending was below the quarterly pace needed to reach full-year guidance because several completions moved into the next quarter.
Free cash flow was positive, but net debt declined only modestly after acquisition costs and working-capital uses.
Fully diluted shares increased 8%, leaving production per share up only about 4% before considering the added debt.
This does not automatically make the quarter poor. The acquisition may ultimately create value, deferred completions may come online successfully and the hedge book may protect the balance sheet. But the correct conclusion is more nuanced than “record production and an earnings beat.” The investor must now test whether incremental cash flow and inventory value exceed the capital, debt and dilution used to obtain them.

What investors should monitor
Production by commodity and basin versus prior quarter and guidance—not merely total BOE.
Realized prices before and after hedges, including regional basis and transportation deductions.
Lease operating, gathering, transportation, cash G&A and interest expense on a per-unit basis.
Capital spending versus the activity delivered and the implied pace required to meet annual guidance.
Cash flow from operations before and after working-capital changes.
Net debt, liquidity, debt maturities and interest cost under a mid-cycle commodity-price deck.
Basic and fully diluted shares, including stock compensation, acquisition shares, warrants and convertibles.
Production and free cash flow per fully diluted share.
Inventory consumption, well productivity and whether current activity supports future production.
Guidance revisions, including which operating assumptions changed and what the new range requires.
Common mistakes to avoid
Treating BOE as economic equivalence: Commodity mix matters. A gas-heavy barrel equivalent does not carry the same revenue or margin as an oil barrel.
Using benchmark prices as realized prices: Basis, quality, transport and hedges can materially alter what reaches the income statement and cash flow statement.
Calling all capital “maintenance” or all capital “growth”: The split is an analytical estimate. Test it against decline rates, activity and production trajectory.
Accepting adjusted free cash flow without reconciliation: Definitions vary. Rebuild the metric from cash flow and capital spending, then identify timing and working-capital effects.
Ignoring dilution because a buyback was announced: Measure the net fully diluted share count and per-share outcomes.
Annualizing one quarter mechanically: E&P results are seasonal and lumpy. Completion timing, weather, working capital and hedge settlements can distort a single period.
Assuming lower debt proves structural deleveraging: Commodity prices or asset sales may have done the work. Test debt capacity at normalized prices.
Letting the stock reaction determine the conclusion: The market may be reacting to expectations, positioning or a single guidance item. Reconcile the facts independently.
The 15-minute first pass
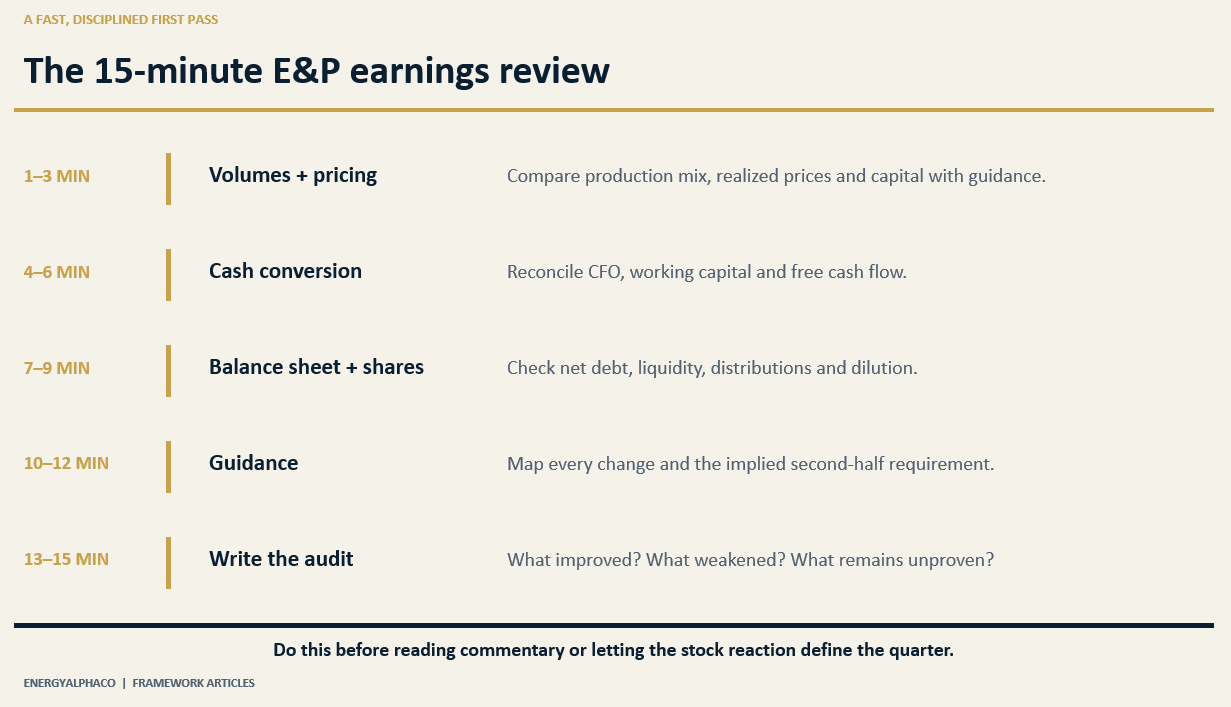
When time is limited, use this compact sequence before reading commentary or listening to the call:
Final takeaway
An E&P earnings release should be read as a chain, not a collection of highlights: assets produce volumes; volumes receive realized prices; realized revenue must cover operating costs and capital needs; residual cash changes the balance sheet or is returned to owners; and the result must ultimately be measured per fully diluted share.
The disciplined investor asks four questions every quarter: Did the assets improve? Did realized pricing match the commodity thesis? Did the company convert performance into sustainable free cash flow? And did that cash flow increase per-share value without creating unacceptable balance-sheet or inventory risk?
That is the difference between reading the release and auditing the thesis.