
Crescent Energy Q2 2026: The Cash Flow Arrived. The Per-Share Test Remains.
Tracking what changed in the CRGY Thesis Audit after the earnings release, presentation and management call.
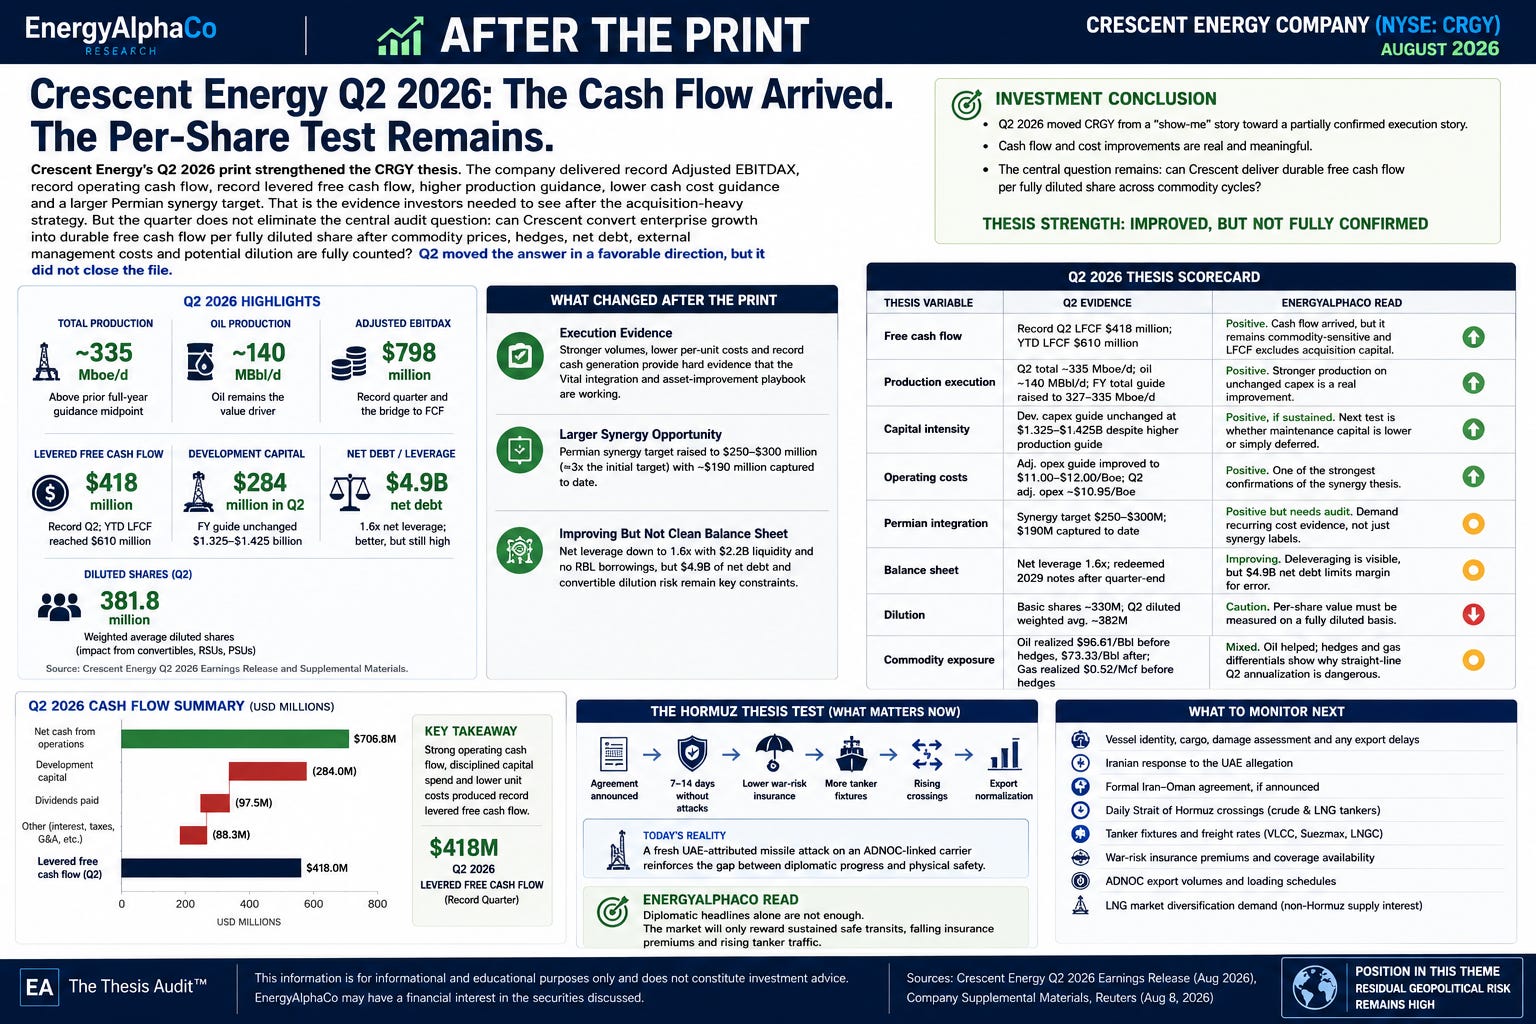
Investment conclusion: Crescent Energy's Q2 2026 print strengthened the CRGY thesis. The company delivered record Adjusted EBITDAX, record operating cash flow, record levered free cash flow, higher production guidance, lower cash cost guidance and a larger Permian synergy target. That is the evidence investors needed to see after the acquisition-heavy strategy.
But the quarter does not eliminate the central audit question: can Crescent convert enterprise growth into durable free cash flow per fully diluted share after commodity prices, hedges, net debt, external management costs and potential dilution are fully counted? Q2 moved the answer in a favorable direction, but it did not close the file.
What changed after the print
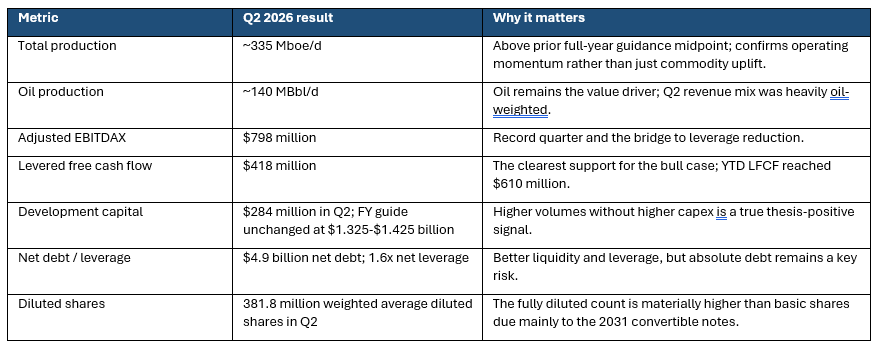
The Q2 print moved Crescent from a “show-me” story toward a partially confirmed execution story. Before Q2, the market could reasonably argue that the Vital integration, Permian cost savings and 2026 free-cash-flow target were still mostly forward-looking. After Q2, the company has at least one quarter of hard evidence: stronger volumes, lower per-unit costs, a raised production outlook and record cash generation.
The most important change is not that oil prices were high. That helped. The important change is that Crescent raised production guidance and lowered operating-cost guidance while leaving development capital unchanged. For an acquisition-led E&P, that is exactly the pattern investors need: more barrels and lower unit costs without a capital-budget reset.
The second change is that the Permian synergy story became larger and more specific. Crescent now points to a $250 million to $300 million synergy target, roughly three times the initial $90 million to $100 million target, with approximately $190 million captured to date. The claim is still management-provided and requires future verification, but Q2 provides more evidence than Q1 that the asset-improvement playbook is producing measurable results.
The third change is that the balance-sheet picture improved but did not become clean. Crescent ended Q2 with about $4.9 billion of net debt, no borrowings under the main RBL, roughly $2.2 billion of liquidity and a weighted-average maturity of about six years. At the same time, debt is still large in absolute terms, interest expense is meaningful, and the 2031 convertible notes can dilute shareholders above the conversion price.
Q2 Thesis Scorecard
The quarter in company-reported facts
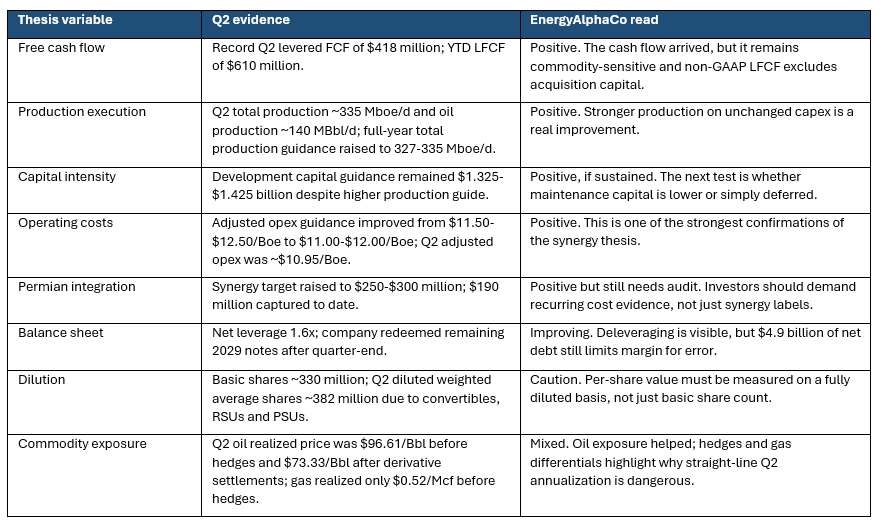
Crescent reported Q2 revenue of $1.395 billion, net income attributable to Crescent Energy of $492.8 million and diluted EPS of $1.30. The higher GAAP result was helped by a $181.9 million gain on derivatives, but the better measure for the thesis is cash generation: net cash provided by operating activities was $706.8 million in Q2, while levered free cash flow was $417.7 million.
Production was 30.5 MMBoe for the quarter, or 335 Mboe/d. Oil volumes were 140 MBbl/d, natural gas volumes were 715 MMcf/d and NGL volumes were 76 MBbl/d. The revenue mix was unusually oil-heavy: oil represented 89% of Q2 production revenues, compared with 71% in Q2 2025. That mix is good when oil is strong, but it also means the stock remains very exposed to oil-cycle assumptions.
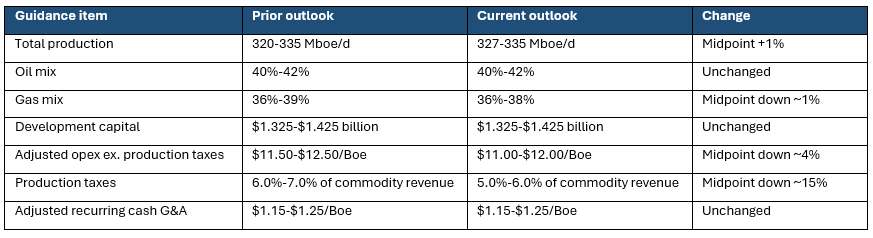
The company raised its full-year production outlook to 327-335 Mboe/d from 320-335 Mboe/d, while leaving development capital unchanged at $1.325-$1.425 billion. It also lowered adjusted operating expense guidance to $11.00-$12.00/Boe from $11.50-$12.50/Boe and lowered production-tax guidance to 5.0%-6.0% of commodity revenue from 6.0%-7.0%. These guidance changes are modest in percentage terms, but important in thesis terms because they improve free cash flow without relying solely on higher commodity prices.
Free cash flow: strong quarter, but do not annualize it blindly
The bull case has always been simple: Crescent does not need a heroic multiple if it can consistently generate large free cash flow, reduce debt and avoid per-share dilution. Q2 gave that argument its best evidence yet. At roughly $418 million of levered free cash flow in one quarter, Crescent demonstrated that the combined asset base can produce cash at a scale that matters relative to its equity value.
Still, the quarter should not be annualized mechanically. Q2 benefited from high oil prices. Average NYMEX oil was $92.79/Bbl, and Crescent realized $96.61/Bbl before derivative settlements. After derivative settlements, however, oil realization fell to $73.33/Bbl. Natural gas was the mirror image: reported gas realization was only $0.52/Mcf before hedges and $1.74/Mcf after hedges. That is an important warning sign for investors who want to treat one strong quarter as normalized earning power.
EnergyAlphaCo interpretation: Q2 materially increases confidence that Crescent can reach or exceed a roughly $1 billion 2026 levered-free-cash-flow framework if the commodity backdrop remains supportive. It does not prove that $1 billion is a mid-cycle number. The right valuation question is not whether Q2 was good; it was. The right question is how much of the Q2 cash flow survives at lower oil prices, weaker gas basis and a more normalized hedge book.
Permian integration: the synergy claim is becoming more testable
The Permian assets are now the most important audit area. Crescent originally acquired Vital with a thesis that the same assets could be run better under Crescent ownership. In Q2, management increased the expected synergy range to $250 million-$300 million from an original target of $90 million-$100 million and said approximately $190 million had been captured to date.
The presentation provides useful operational detail: management points to lower well costs, lower operating costs, field optimization, workovers, artificial lift, commercial optimization and supply-chain savings. Crescent also reported Q2 Permian production of 124 Mboe/d, 42% oil, on $104 million of capital spend, excluding Crescent Royalties.
EnergyAlphaCo view: this is the most thesis-positive part of the print, but it remains an audit item rather than a fully verified conclusion. Synergies are real only if they appear in recurring unit costs, capital efficiency and free cash flow after one-time integration benefits fade. The next two quarters should show whether the $250 million-$300 million target is a durable run-rate improvement or a partly front-loaded integration claim.
Balance sheet and dilution: better, not clean
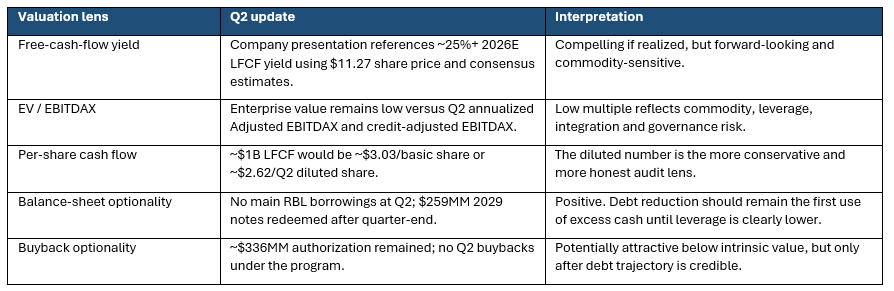
Crescent ended Q2 with $5.166 billion of long-term debt and $264.9 million of cash, implying about $4.9 billion of net debt. Net leverage was 1.6x on the company’s credit-agreement methodology. The company also had no borrowings outstanding under the main revolving credit facility at quarter-end, and liquidity was roughly $2.2 billion. After quarter-end, Crescent redeemed the remaining $259 million of 2029 notes at par.
This is meaningful progress. It reduces near-term refinancing risk and supports the path toward a lower cost of capital. But the balance sheet still matters. Absolute net debt is large relative to the equity market capitalization, interest expense was nearly $100 million in Q2, and deleveraging can be interrupted quickly if management uses free cash flow for acquisitions before the market sees per-share proof.
Dilution also needs explicit treatment. Basic shares outstanding were about 330.4 million at July 31, 2026, but Q2 weighted-average diluted shares were 381.8 million. The difference is mainly the 2031 convertible notes and equity awards. The convertible notes have an initial conversion price of about $14.89 per share and are partly protected by capped calls up to $22.48, but the accounting and economic point remains: valuation should be tested on a fully diluted basis.
External management remains a governance and per-share-value issue
Crescent’s external management structure is not new, but it deserves renewed scrutiny now that the company is larger. The Manager receives annual cash compensation of $78.5 million as of June 30, 2026, and that amount can increase by 1.5% per annum of the net proceeds from future primary equity issuances. The Manager also receives incentive compensation through performance stock units. Crescent recorded $19.7 million of non-cash Manager PSU expense in Q2 and $40.8 million for the first half of 2026.
This structure does not make the thesis uninvestable. It does mean investors should be more demanding. The hurdle is not whether Crescent grows production, EBITDA or assets. The hurdle is whether shareholders receive rising fully diluted free cash flow per share after manager compensation, equity awards, convertibles and any acquisition-related share issuance.
Commodity and hedge sensitivity: oil helped, gas warned
Q2 was a strong oil quarter. Crescent’s oil realization before derivative settlements was above the average NYMEX price, supported by oil pricing and differentials. But hedges materially reduced realized oil upside. The company recorded a realized oil derivative loss of $295.6 million in Q2, partially offset by a realized natural gas derivative gain of $79.2 million.
The gas result is more concerning. Crescent reported a Q2 natural-gas realized price of only $0.52/Mcf before derivative settlements. That reflected lower index pricing and weaker differentials after the Vital acquisition and the resulting Permian exposure. Hedges lifted the realized gas price to $1.74/Mcf, but investors should not ignore the underlying differential problem. Gas is not the dominant value driver today, but Permian gas realizations can still erode free cash flow and investor confidence.
The hedge book is doing what it is designed to do: reduce volatility. But for equity valuation, hedges also make the cash-flow picture more complicated. They protect downside in weak gas environments but give up upside in strong oil environments. A credible valuation case has to model both effects, not simply cite headline oil prices.
Valuation update: Q2 supports the base case, not the exceptional case
At a recent market price of approximately $11.57 per share, Crescent’s basic equity market value is roughly $3.8 billion using about 330.4 million shares outstanding. Using Q2 net debt of about $4.9 billion, the company’s enterprise value is roughly $8.7 billion on a basic-share basis. If investors use the Q2 diluted share count instead, the implied equity value is closer to $4.4 billion and the enterprise value is closer to $9.3 billion.
Against those numbers, the valuation is still undemanding if Crescent can generate roughly $1 billion of 2026 levered free cash flow and keep net debt moving lower. On basic shares, $1 billion of LFCF would equal roughly $3.03 per share; on the Q2 diluted share count, it would equal roughly $2.62 per share. The fixed annual dividend of $0.48 per share consumes only a modest portion of that potential cash flow, leaving room for debt reduction and opportunistic buybacks if management prioritizes per-share value.
EnergyAlphaCo view: Q2 supports the prior base-case framework and reduces the probability that Crescent is merely an acquisition roll-up with inflated adjusted metrics. But it does not justify moving the bull case into the base case. The valuation multiple should remain discounted until investors see continued debt reduction, recurring cost improvements, disciplined acquisition behavior and stable fully diluted share count.
What must be true from here
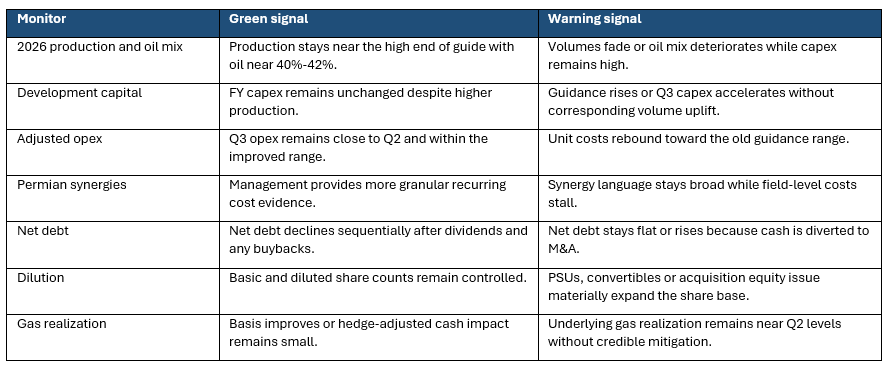
Full-year production must remain within or above the new 327-335 Mboe/d guide while development capital stays inside $1.325-$1.425 billion.
Adjusted operating expense needs to remain near the low end of the new $11-$12/Boe range without hidden cost leakage in workovers, G&A or capitalized costs.
Permian synergies must increasingly appear in recurring field-level costs, well costs and capital efficiency rather than relying on one-time integration benefits.
Free cash flow must be allocated first to net-debt reduction and only then to buybacks or M&A, unless acquisitions are clearly accretive on a fully diluted per-share basis.
The diluted share count must be treated as real economic dilution when valuing the company, especially if the stock trades above the convertible conversion price.
Gas differentials and Waha exposure must remain manageable; hedges can reduce volatility, but they cannot fix poor underlying realized pricing forever.
What investors should monitor before Q3
Thesis breakers
Crescent misses the updated production or cost guidance while oil prices remain supportive.
Free cash flow fails to translate into net-debt reduction over the next two quarters.
The Permian synergy target rises in presentation form but does not appear in recurring unit costs and capital efficiency.
Management pursues another large acquisition before the market has evidence that Vital is fully integrated and per-share accretive.
Fully diluted share count expands materially beyond the already disclosed convertible and equity-award impact.
Natural gas differentials remain poor enough to offset oil-led cash flow gains.
External-management compensation and incentive awards absorb too much of the value created by operating improvements.
Final assessment
Crescent’s Q2 print was thesis-positive. The company delivered the kind of quarter that an acquisition-led E&P must deliver: higher production, lower unit costs, record free cash flow, improved guidance and progress on leverage. It also gave investors stronger evidence that the Vital acquisition may be more than a balance-sheet and production roll-up.
The stock still deserves a discount to cleaner, simpler E&Ps because of absolute debt, hedge complexity, weak gas realizations, external management, convertible dilution and acquisition-execution risk. But after Q2, the discount looks harder to justify if Crescent continues to convert operating gains into fully diluted free cash flow per share.
EnergyAlphaCo classification: Starter Position candidate / not yet Core Holding. Q2 moved CRGY in the right direction, but a Core Holding classification should require at least two more confirmations: visible net-debt reduction and evidence that the expanded Permian synergy target is showing up in recurring cash margins, not just in management slides.
Sources and investment-risk disclosure
Crescent Energy Company, Quarterly Report on Form 10-Q for the quarter ended June 30, 2026, filed August 3, 2026.
Crescent Energy Company, Q2 2026 Earnings Presentation, August 2026.
Crescent Energy Company, Exhibit 99.1 Q2 2026 earnings release, filed with the SEC.
Seeking Alpha external research article, “Crescent Energy: The Free Cash Flow Doesn’t Lie - This One Is Way Too Cheap To Ignore,” July 7, 2026. Used as third-party opinion only.
Seeking Alpha external research article, “Crescent Energy: Concentrating On Free Cash Flow Growth,” July 11, 2026. Used as third-party opinion only.
Market data used for rough valuation math: CRGY recent price of approximately $11.57 as of August 7, 2026. Update market price before publication.
Investment-risk disclosure
This material is for informational and educational purposes only and does not constitute individualized investment advice, an offer to buy or sell securities, or a recommendation regarding any security. Energy investments involve substantial commodity-price, operating, financial, regulatory and market risk. Scenario values are conditional estimates, not forecasts or price targets. Readers should conduct their own due diligence and consider their own objectives and risk tolerance.