
Can LNG and AI Break the U.S. Gas Market by 2029?
Auditing Matt Smith's natural-gas storage-collapse thesis


Investment conclusion
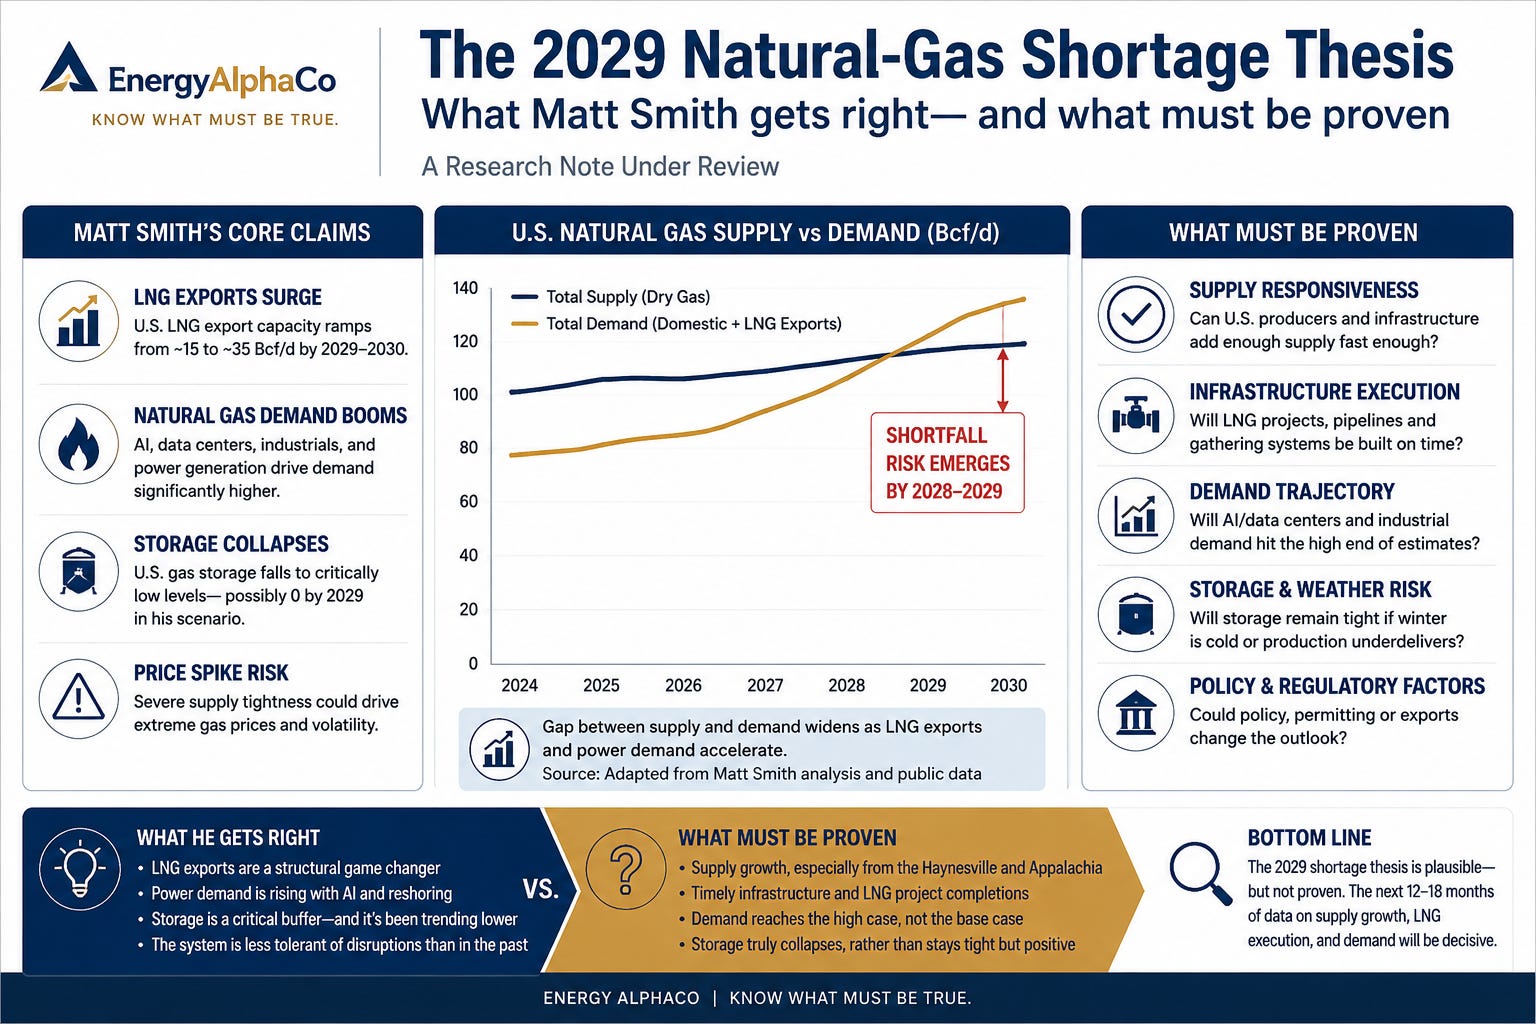
Matt Smith’s warning deserves to be taken seriously.
His central argument is that the United States is committing to two unusually large sources of natural-gas demand - LNG exports and AI-related electricity consumption - without building enough wells, gathering systems, processing plants and pipelines to supply both. In the version of the thesis presented in the supplied articles, U.S. LNG demand grows by approximately 20 Bcf/d, AI and data centers add another 5 Bcf/d, and domestic production can increase by only about 20 Bcf/d. The resulting 5 Bcf/d deficit would drain roughly 1.8 Tcf of storage in a single year and push inventories below historical precedent by 2028-2029.
EnergyAlphaCo’s conclusion is more measured: Smith is probably directionally right that the forward market underestimates the risk of structural tightening. He has not yet proved that U.S. storage will literally approach exhaustion by 2029.
The distinction matters.
The LNG buildout is real. Electricity demand is accelerating. Data centers require large quantities of dependable power. Gas production must overcome steep legacy declines before it can grow. Permian associated gas, Haynesville development and Appalachian resources cannot reach every demand center without gathering, processing and pipeline investment.
But the market would not allow a persistent 5 Bcf/d deficit to drain storage mechanically toward zero while prices, drilling, exports and consumption remained unchanged. Long before inventories disappeared, some combination of higher Henry Hub prices, additional drilling, greater Canadian imports, delayed data-center projects, reduced industrial demand, coal switching, lower LNG utilization and policy intervention would begin clearing the market.
The likely investment outcome is therefore not a quiet slide to empty storage. It is a nonlinear price response.
That still creates a potentially compelling setup for well-positioned natural-gas producers. It also means investors should separate three questions that are often blurred together:
1. Is U.S. natural-gas demand about to rise materially? Yes.
2. Can supply and infrastructure respond without significantly higher prices? Uncertain.
3. Will storage collapse below all historical experience by 2029? Possible, but not EnergyAlphaCo’s base case.
Our audit finds the thesis strongest as a warning about price convexity and inadequate infrastructure, and weakest where aggressive nameplate-capacity assumptions are treated as certain physical demand.
The thesis in one paragraph
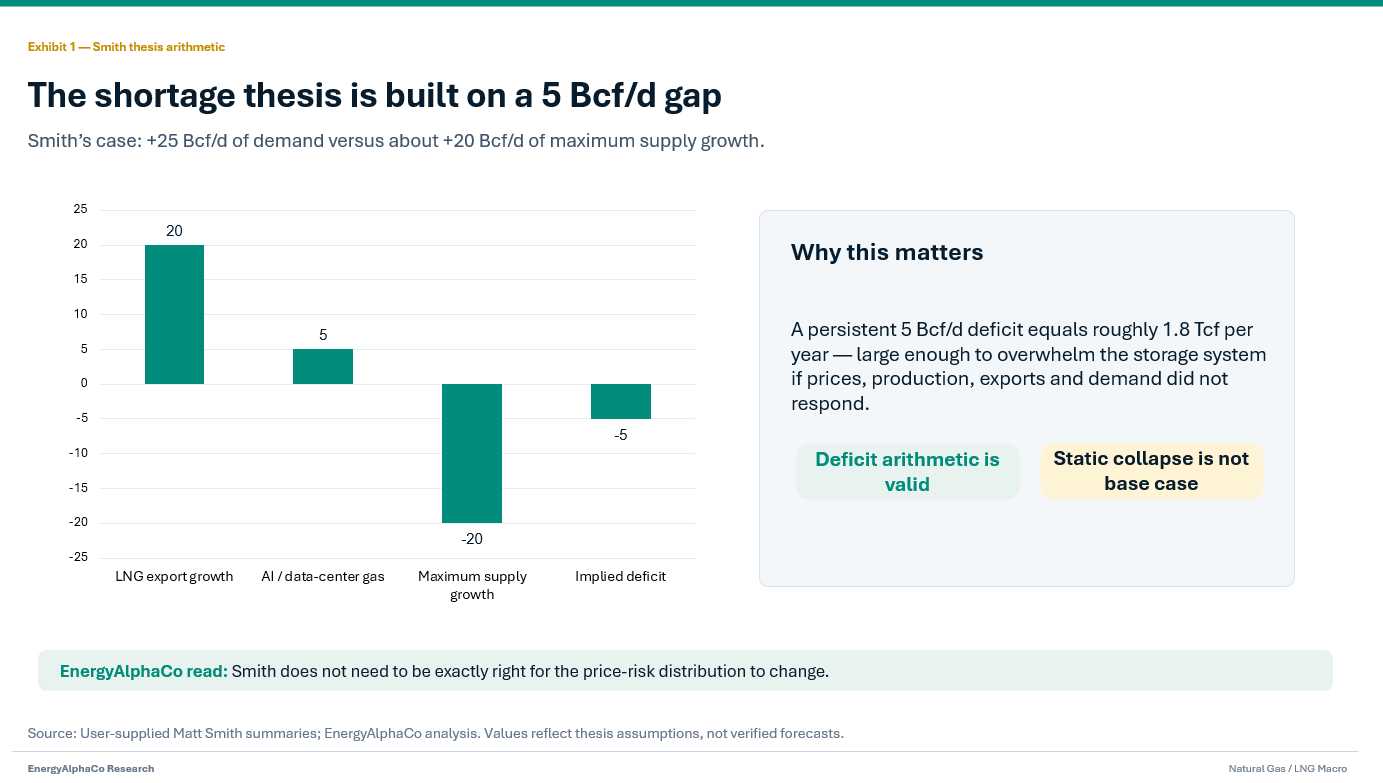
Smith’s model begins with U.S. production of approximately 110-112 Bcf/d. The articles attribute to him an expectation that LNG export capacity will increase from roughly 15 Bcf/d to 35 Bcf/d by 2030. His base case adds approximately 5 Bcf/d of AI-related gas demand. Against that 25 Bcf/d demand increase, his bottom-up well model limits production growth to about 20 Bcf/d, or a maximum system output of approximately 128-132 Bcf/d. The missing 5 Bcf/d must come from storage, causing inventories to breach historical floors by 2028 and fall further in 2029.
The thesis is not that the United States lacks gas in the ground. It is that sufficient gas cannot be made deliverable at the correct locations and on the required timetable.
Smith identifies a chain of constraints: well inventory, gathering, processing, interstate transportation, LNG and power demand, and storage.
That is the thesis’s most important contribution. Resource estimates alone do not power an LNG terminal or data center. Gas must be produced, treated, compressed and transported through physical infrastructure before it can satisfy demand.
Why the opportunity may exist
The market has been trained by two decades of shale development to assume that higher gas prices will quickly produce more supply.
That assumption has often been correct. Stronger prices stimulate drilling, producers improve completions, private operators increase activity and production eventually outruns demand. Gas equities can therefore underperform even when long-term consumption is rising.
The current official outlook still reflects that broad framework. The Energy Information Administration expects record production to meet rising LNG and power-sector demand, with Henry Hub averaging close to $3.70/MMBtu in 2026 before falling below $3.50 in 2027.
Yet the official balance is already narrow.
From 2025 through 2027, EIA forecasts approximately 7.65 Bcf/d of dry-gas production growth. Over the same period, domestic consumption rises about 3.14 Bcf/d, LNG exports increase approximately 3.5 Bcf/d and pipeline exports add roughly another 0.5 Bcf/d. Expected production growth therefore exceeds combined demand and export growth by only about 0.5 Bcf/d.
That is not an official shortage forecast. It is a forecast that assumes supply responds almost perfectly.
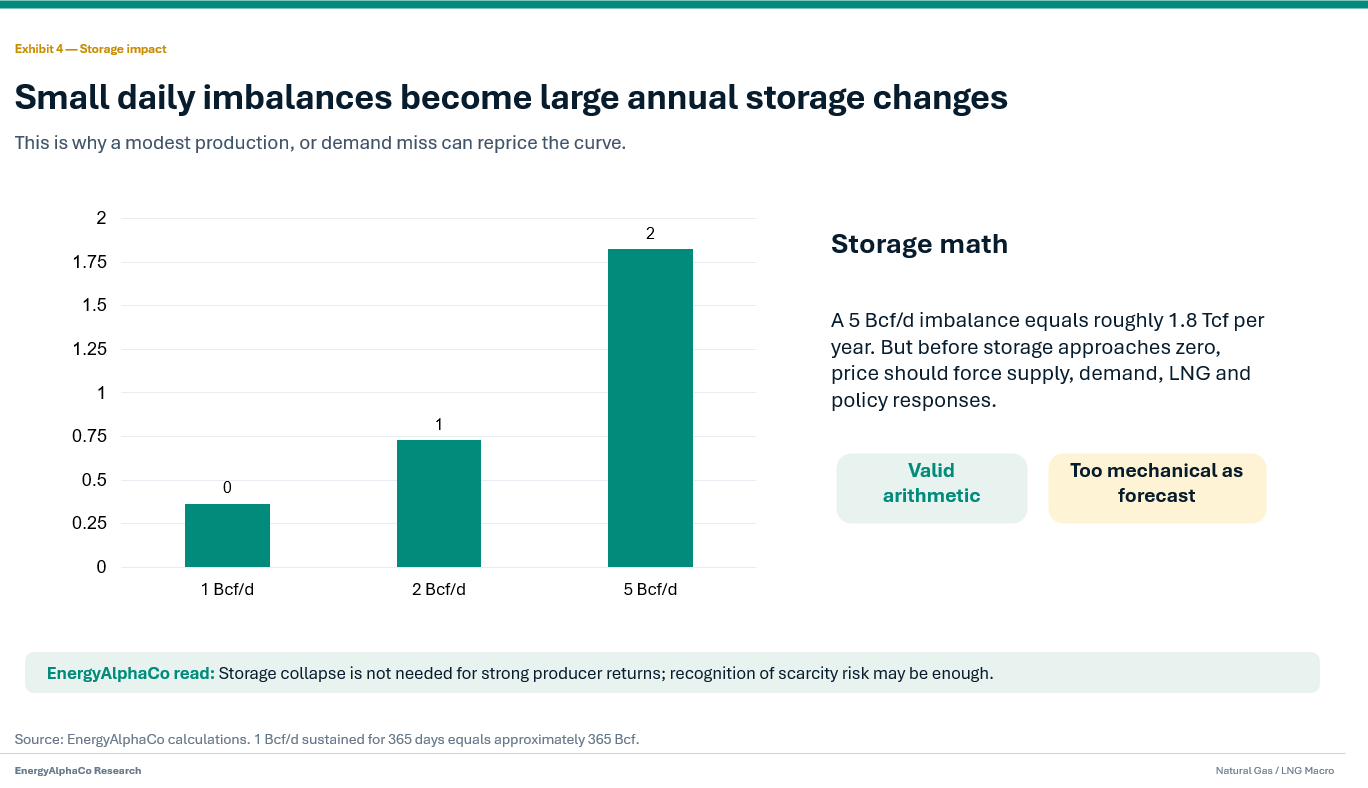
A 1 Bcf/d error sustained for one year changes the storage balance by approximately 365 Bcf. A 2 Bcf/d miss changes it by 730 Bcf. Smith does not need to be completely correct for the commodity and equity implications to become meaningful.
The Thesis Audit
Claim 1: LNG export capacity will rise to 35 Bcf/d by 2030
Smith’s case
The supplied summaries attribute to Smith a view that LNG export capacity will increase from roughly 15 Bcf/d to 35 Bcf/d by 2030. He treats much of this growth as effectively committed because projects have received permits, financing and long-term customer contracts.
What the primary sources say
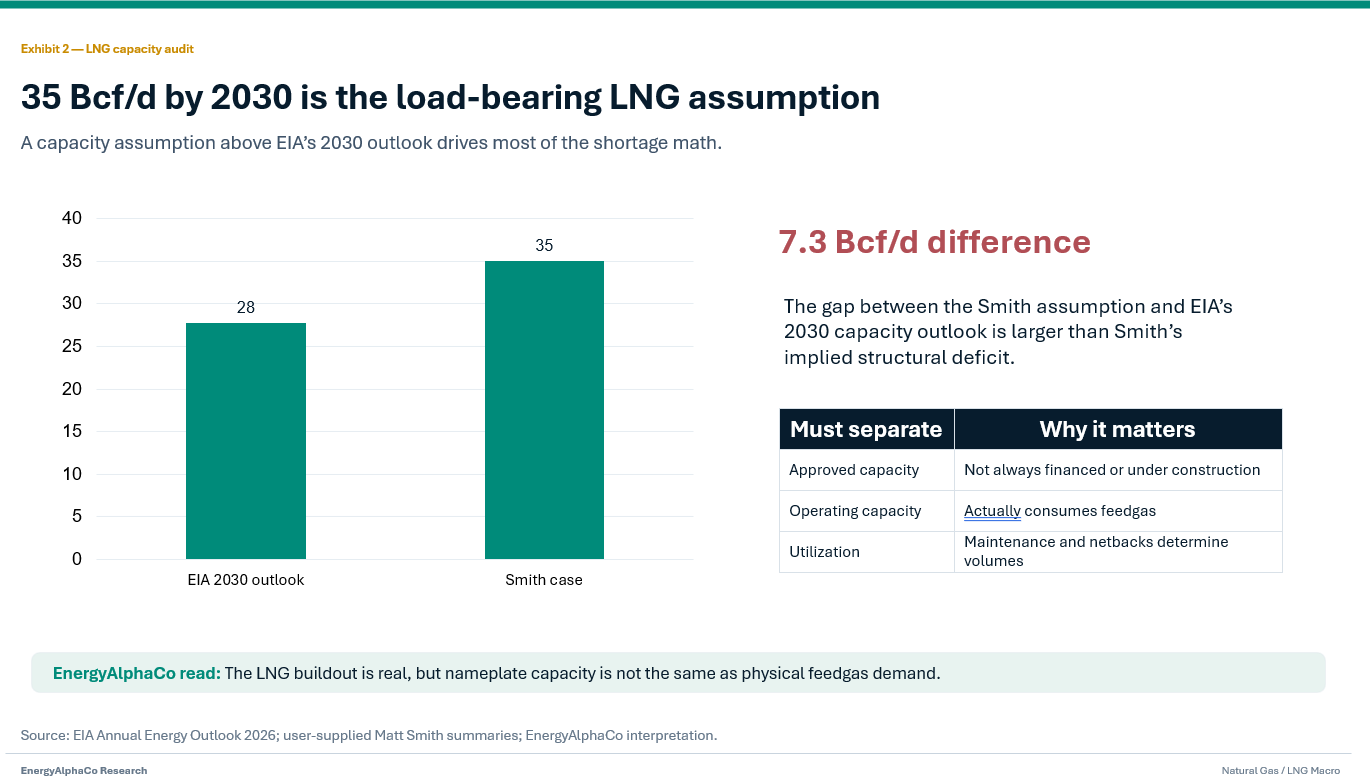
EIA’s 2026 Annual Energy Outlook currently expects U.S. LNG export capacity to reach 27.7 Bcf/d by 2030, materially below the 35 Bcf/d figure attributed to Smith. EIA expects LNG export volumes to exceed 30 Bcf/d in most cases only later in the outlook period, not necessarily by 2030.
A separate EIA analysis expected total North American LNG export capacity to reach 28.7 Bcf/d in 2029 if projects under construction began operating on schedule. That figure included Canadian and Mexican terminals as well as U.S. facilities.
FERC’s June 2026 terminal list confirms a very large pipeline of operating, commissioning, approved and proposed U.S. projects. It also demonstrates why project status matters: an operating train is not equivalent to an approved but unfunded terminal, and neither is equivalent to a proposed project.
EnergyAlphaCo verdict
Aggressive and not independently verified.
The 35 Bcf/d figure may represent a broader universe of permitted, under-construction or proposed nameplate capacity. It should not automatically be treated as 35 Bcf/d of actual feedgas consumption in 2030.
A credible model must distinguish nameplate liquefaction capacity, feedgas requirements, commercially operating capacity, commissioning volumes, planned and unplanned outages, utilization rates, project delays, and contracted versus merchant capacity.
The difference between 27.7 Bcf/d and 35 Bcf/d is 7.3 Bcf/d - larger than Smith’s entire modeled deficit. That makes the LNG-capacity assumption one of the thesis’s most consequential variables.
However, EIA’s lower forecast does not invalidate the broader argument. An increase from roughly 15 Bcf/d to 27.7 Bcf/d would still represent nearly 13 Bcf/d of incremental export capacity - an enormous call on U.S. supply.
Claim 2: AI and data centers will add approximately 5 Bcf/d of gas demand
Smith’s case
Smith reportedly builds his approximately 5 Bcf/d base case from projects with relatively high development confidence, including signed power agreements, interconnection progress and credible construction timelines. A more aggressive scenario reaches 12-15 Bcf/d in the early 2030s.
What the primary sources say
The direction of electricity-demand growth is well supported.
Lawrence Berkeley National Laboratory estimates that U.S. data centers consumed approximately 176 TWh in 2023 and could consume between 325 TWh and 580 TWh in 2028. That would represent approximately 6.7%-12% of total U.S. electricity consumption.
PJM’s 2026 forecast projects summer peak demand rising by approximately 65.7 GW through 2036 and annual net energy requirements increasing by about 581.6 TWh. PJM also lowered portions of its prior forecast after applying more rigorous adjustments to data-center and large-load requests, illustrating that announced load is not the same as dependable demand.
EIA expects natural-gas consumption by the power sector to reach a record 38.1 Bcf/d in 2027, with a projected monthly peak of 50.6 Bcf/d in July 2027.
Reconstructing the gas equivalent
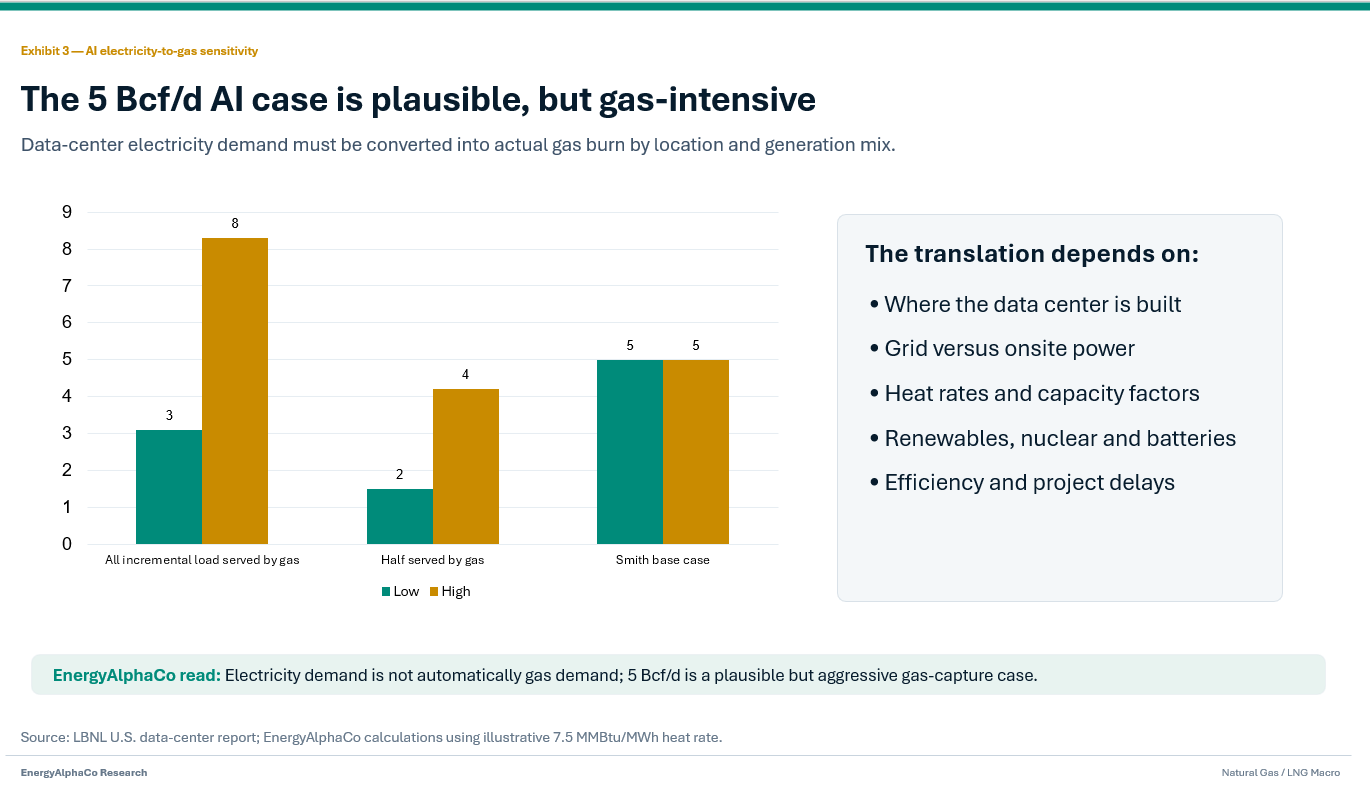
The LBNL range implies incremental data-center electricity consumption of approximately 149-404 TWh between 2023 and 2028.
Using an illustrative gas-plant heat rate of 7.5 MMBtu per MWh:
· If all incremental demand were supplied by natural gas, the equivalent increase would be approximately 3-8 Bcf/d.
· If gas supplied roughly half of the incremental electricity, the equivalent would be approximately 1.5-4 Bcf/d.
· Reaching 5 Bcf/d would require natural gas to supply a large share of the incremental load, or substantial behind-the-meter gas generation in addition to grid demand.
These are EnergyAlphaCo calculations, not EIA or LBNL forecasts.
EnergyAlphaCo verdict
Plausible, but not yet a verified base case.
Smith’s 5 Bcf/d estimate is not inherently unreasonable. It is toward the higher end of a defensible 2028 range and becomes more plausible if data-center electricity use approaches the upper portion of LBNL’s range, gas captures a large share of new generation, behind-the-meter generation expands, transmission constraints delay alternatives and efficiency gains do not materially reduce load.
It becomes less likely if projects are delayed or duplicated across multiple development queues, renewables, existing nuclear, batteries and grid imports serve a larger share, computing efficiency improves faster than expected or hyperscalers accept more flexible load profiles.
The 5 Bcf/d figure should be treated as a gas-intensive scenario, not a settled fact.
Claim 3: U.S. production cannot grow beyond approximately 128-132 Bcf/d
Smith’s case
This is the most differentiated part of the thesis.
Smith reportedly constructed a well-level model incorporating producing wells, decline curves, operator acreage and remaining drilling locations. His conclusion is that core inventory in the Haynesville, Appalachia and Permian will be depleted faster than company presentations imply, limiting practical deliverability to approximately 128-132 Bcf/d.
What the primary sources say
EIA’s long-term outlook does not validate an absolute ceiling near 132 Bcf/d. Its 2026 Annual Energy Outlook projects U.S. natural-gas production rising from approximately 107 Bcf/d in 2025 to between 133 Bcf/d and 151 Bcf/d by 2050 across most cases. EIA also acknowledges that this growth requires substantial pipeline expansion, particularly from Appalachia toward Gulf Coast demand.
That does not prove the system can produce more than 132 Bcf/d by 2028-2030. It does show that Smith’s ceiling is a proprietary analytical conclusion, not an established consensus fact.
The infrastructure response is also more active than a simple “no pipelines are being built” narrative suggests. EIA reports that developers plan approximately 44.9 Bcf/d of pipeline-capacity additions during 2026 and 2027, with 31.6 Bcf/d already under construction. Most of that planned capacity originates in Texas and Louisiana.
Pipeline-capacity additions are not all equivalent to new long-haul interstate systems. Many are intrastate pipelines, expansions, loops or laterals serving LNG terminals and producing basins. Smith’s criticism of major interstate permitting therefore remains relevant, but the broader infrastructure system is not standing still.
The inventory question cannot be resolved from company slides
Smith is right that “years of inventory” can be misleading.
Corporate inventory estimates may include locations outside the economic core, undeveloped zones, tighter spacing assumptions, wells without gathering or processing plans, locations requiring higher commodity prices, acreage that competes for corporate capital and inventory with materially lower returns than recent wells.
The correct audit requires engineered locations, expected recoveries, development costs, decline curves and surface infrastructure - not simply acreage multiplied by assumed well spacing.
However, Smith’s own well-level model is not publicly available in the supplied material. Without the underlying location database, type curves, spacing assumptions and infrastructure constraints, EnergyAlphaCo cannot independently confirm the 128-132 Bcf/d ceiling.
EnergyAlphaCo verdict
The most important claim - and the least independently verifiable.
Smith’s broader reasoning is credible: the limiting factor may be economic and deliverable inventory rather than geological resource.
But a production ceiling is partly a function of price.
At $3 gas, many locations and infrastructure projects may not work. At $5 or $7, the economic inventory expands, service companies add capacity, gathering systems are built, imports increase and producers accept lower-quality acreage.
The correct question is not whether the United States can ever exceed 132 Bcf/d. It is: what sustained Henry Hub price and capital investment are required to move production above 125, 130 or 135 Bcf/d?
If the answer is materially above the current forward curve, Smith’s investment thesis can be right even if his absolute ceiling proves too low.
Claim 4: A 5 Bcf/d deficit will collapse storage by 2029
The arithmetic
The arithmetic is straightforward.
A sustained deficit of 5 Bcf/d equals 35 Bcf per week, approximately 152 Bcf per month and approximately 1.825 Tcf per year.
A deficit of that size would overwhelm the normal storage system quickly. Smith’s conclusion that such a balance cannot persist is correct.
The missing step: market clearing
The weakness is treating the deficit as if it can continue without changing the assumptions that created it.
Natural-gas markets clear through price. As storage tightens, higher prices would trigger responses across both supply and demand.
· Supply responses: more gas-directed drilling, higher completion activity, higher-cost inventory, associated gas, Canadian imports, gathering and processing investment, pipeline expansions, refracs and reduced curtailments.
· Demand responses: industrial curtailment, reversal of coal-to-gas switching, lower gas-fired generation where alternatives exist, delayed data-center projects, accelerated renewables and storage, lower LNG utilization and policy intervention.
The fact that these responses may be expensive, delayed or politically difficult is precisely why prices could rise sharply. It is also why literal storage exhaustion is not the most probable outcome.
EnergyAlphaCo verdict
The deficit arithmetic is valid; the static-collapse conclusion is too mechanical.
Smith’s storage result should be interpreted as a warning that the current forward curve may not contain the price required to prevent that outcome.
The market does not need to reach zero storage for the thesis to generate strong equity returns. It only needs to recognize that considerably higher prices are required to stimulate supply, ration demand or both.
What Matt Smith gets right
1. LNG is more durable than most discretionary demand
Large LNG projects require multiyear permitting, construction, financing and contracting. Once operating, they represent a significant and relatively persistent call on U.S. gas when international netbacks support exports.
Demand will not disappear simply because Henry Hub rises from $3 to $4. Some cargo economics may weaken, but long-term contracts and strategic supply relationships reduce the flexibility of the export system.
2. The market focuses too heavily on gas in the ground
The relevant commodity is not technically recoverable gas. It is gas that can be produced economically and delivered to the required node.
Smith’s emphasis on gathering, processing and pipelines is therefore well founded.
3. Decline replacement is easy to underestimate
Gross new-well production is not the same as net corporate growth.
A producer must first replace declines from its existing base. High initial production rates can obscure the capital required to sustain aggregate output.
4. AI load should be modeled as physical infrastructure
Data-center demand should not be treated as a generic national electricity forecast. It must be matched to specific grid regions, power plants, transmission systems, pipelines and commercial timelines.
Smith’s focus on signed arrangements and credible projects is directionally correct.
5. The right tail may be underpriced
The official EIA outlook assumes record production keeps pace with record demand and holds average Henry Hub below $3.50 in 2027. That may be the median outcome, but it does not capture the full value of a scenario in which production disappoints by several Bcf/d while LNG and power demand arrive largely on schedule.
Where the thesis needs more proof
1. The 35 Bcf/d LNG assumption
The current EIA estimate is 27.7 Bcf/d of U.S. LNG export capacity by 2030. Smith’s higher number requires a transparent project list and probability weighting.
2. The conversion of data-center load into gas demand
Electricity demand is not gas demand. The translation depends on location, generation mix, plant efficiency, capacity factors and project timing.
3. The production ceiling
Smith’s well-level methodology may be more accurate than corporate inventory presentations, but the underlying model must be available before the ceiling can be independently verified.
4. The absence of price response
A storage-collapse model must incorporate endogenous changes in prices, drilling, exports and consumption. Otherwise it illustrates the consequence of an imbalance rather than forecasts the actual path the market will take.
5. The timing
A thesis can be directionally correct and still produce poor investment results if the timing is wrong. Delays to U.S. LNG projects weaken near-term feedgas demand, while delays to non-U.S. LNG supply strengthen global prices. Those effects must be modeled separately.
Reconstructing the 2030 balance
The table below is an EnergyAlphaCo scenario framework, not a company or government forecast.
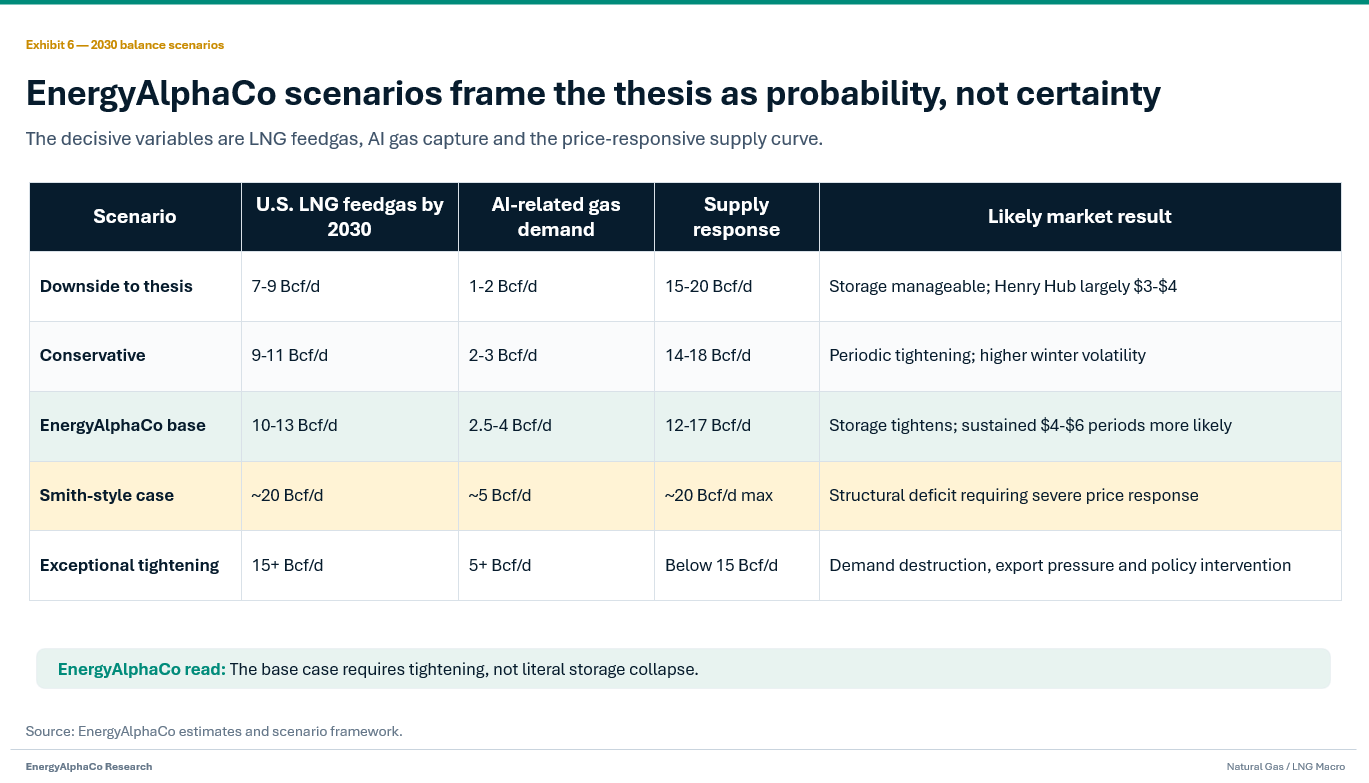
The base-case range is intentionally broad because the critical variables are still unresolved.
The largest difference between EnergyAlphaCo’s base case and the Smith case is not whether demand grows. It is the assumed pace of LNG commissioning and the ability of higher prices to unlock incremental supply.
How the market is more likely to clear
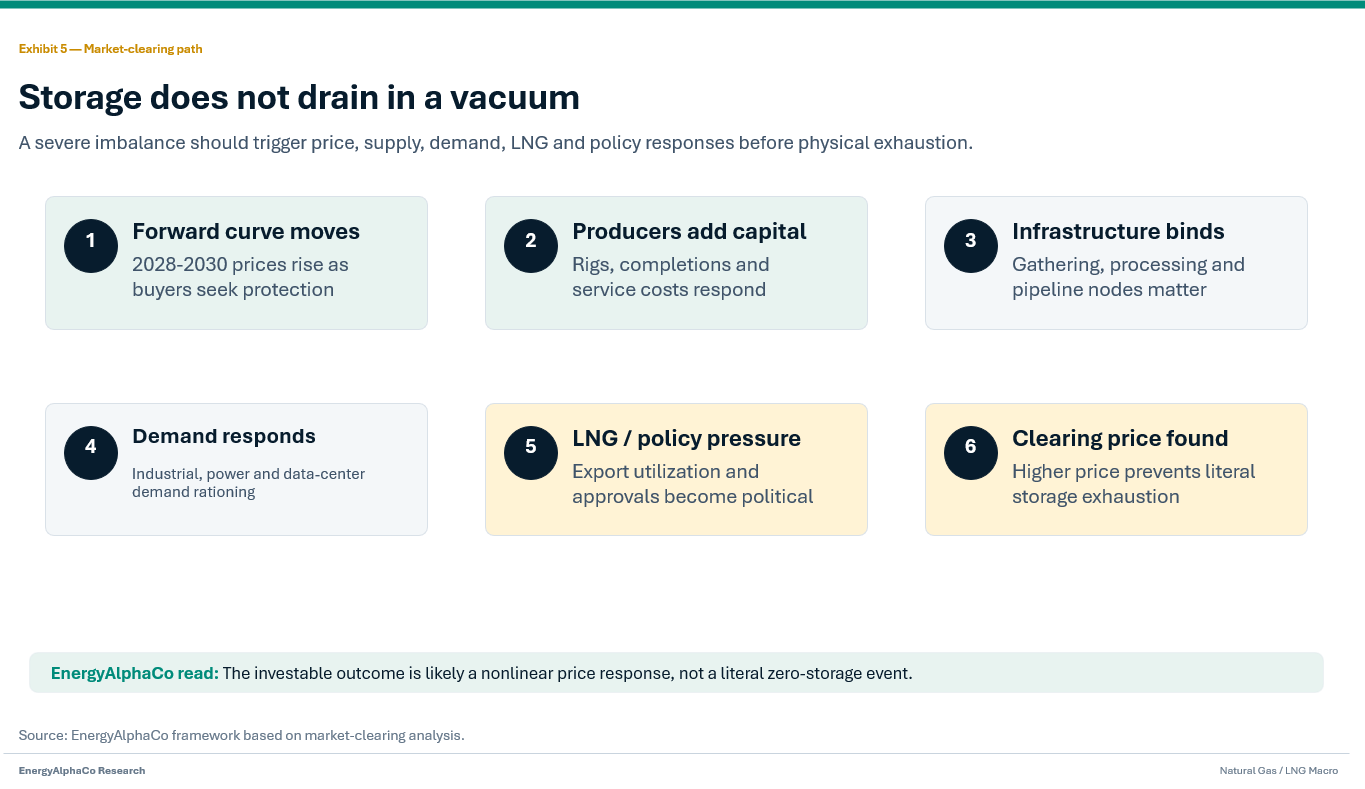
If Smith’s physical warning begins to materialize, the adjustment will probably occur in stages.
Stage 1: The forward curve moves
Calendar 2028-2030 prices rise as utilities, LNG buyers, power developers and large loads seek longer-term protection. This would improve producer drilling economics before a storage crisis is visible.
Stage 2: Producers increase capital
Gas-directed producers add rigs and completion crews. Service costs rise. Private operators respond. Supply increases, but the initial effect on free cash flow may be smaller than equity investors expect because producers must spend more capital.
Stage 3: Infrastructure becomes the binding constraint
Gathering, processing and pipeline capacity determine which basins can grow. Regional basis differentials become more important than Henry Hub alone.
Stage 4: Demand begins responding
Industrial users reduce consumption, marginal power generation shifts where possible, and less-certain data-center projects are delayed.
Stage 5: LNG becomes politically sensitive
If domestic prices rise sharply while exports remain high, political pressure to scrutinize LNG utilization, project approvals or export policy would increase - even if existing contracts make immediate intervention difficult.
Stage 6: The system finds a clearing price
That clearing price may be substantially above the forward curve without storage ever approaching zero.
For investors, this path may be more important than Smith’s literal endpoint. It offers a prolonged period in which low-cost, unhedged gas producers and strategically located infrastructure can earn higher returns.
Equity implications
Natural-gas producers
Smith highlights Expand Energy and Range Resources as likely beneficiaries of a constrained supply environment. His thesis is that companies controlling high-quality remaining inventory will become increasingly valuable as the marginal cost of supply rises.
EnergyAlphaCo agrees with the framework but not with treating acreage quality alone as sufficient.
The producer winners will be those that combine low maintenance capital, long-duration economic inventory, favorable market access, limited hedge constraints, manageable leverage, disciplined production growth, declining fully diluted share counts and high free-cash-flow sensitivity per share.
Expand Energy
Expand offers scale across major gas basins and would likely be one of the most important supply responders in a tighter market. The thesis must still be tested against integration, capital intensity, transportation and fully diluted free cash flow.
Range Resources and Antero Resources
Range and Antero possess differentiated Appalachian assets and market-access portfolios. Their liquids exposure can improve resilience but makes them less pure expressions of Henry Hub.
EQT
EQT combines large-scale Appalachian production with midstream infrastructure. Its resource depth is meaningful, but pipeline access, basis and reinvestment remain central.
Comstock Resources
Comstock provides high dry-gas torque through the Haynesville and Western Haynesville. The company could benefit disproportionately if Gulf Coast LNG and Texas power demand tighten the market.
The investment case requires more than higher gas prices. Comstock must demonstrate competitive Western Haynesville full-cycle returns, sustainable well productivity, controlled drilling and infrastructure costs, free cash flow after maintenance capital, net-debt reduction and limited dilution.
A severe gas-price spike could lift the equity rapidly. A slower $3-$4 environment could leave the company more dependent on capital efficiency and balance-sheet execution.
LNG operators
Operating LNG companies may benefit from global tightness through high utilization, marketing opportunities and expansion value. They are not straightforward Henry Hub investments. Many LNG contracts pass through the feedgas component, meaning higher U.S. gas prices are partly borne by customers. The important variables are fixed liquefaction fees, contract coverage, uncontracted capacity, terminal reliability, expansion returns, debt and capital allocation.
LNG developers
Developers offer greater potential upside but also carry greater construction and financing risk. A bullish LNG macro view does not eliminate cost overruns, project delays, equity issuance, preferred claims, partner economics, regulatory risk or debt-service requirements. The correct valuation is the common shareholder’s fully diluted interest after project debt and partner claims - not the gross value of terminal capacity.
Midstream companies
Smith’s thesis is strongly constructive for pipelines, gathering, compression, processing and storage - with an important qualification. New infrastructure can increase midstream cash flow while also weakening the commodity shortage by allowing more supply to reach demand. The most attractive midstream opportunities will have firm contracts, strong counterparties, attractive returns on invested capital, limited construction exposure, manageable leverage, visible cash-flow start dates and adequate distribution coverage.
Gas turbines and fuel cells
Smith argues that companies supplying gas-consuming equipment may eventually suffer if gas becomes too expensive or unavailable. That conclusion may be premature. In the near term, power scarcity could increase demand for turbines, reciprocating engines and behind-the-meter generation precisely because they are among the few technologies available on an acceptable timeline. The risk may emerge later if gas infrastructure and fuel costs rise and regulators or customers reassess the economics.
Nuclear and renewable power
Higher natural-gas prices would generally improve the relative economics of generation without fuel-price exposure. Existing nuclear, hydroelectric, solar and wind assets could benefit from higher wholesale electricity prices without incurring the same fuel-cost increase. Large-scale nuclear may become part of the long-term solution, but new reactors ordered today would not materially affect a 2028 gas balance. Advanced reactors and microreactors are more likely to influence 2030s expectations than near-term physical demand.
Consumers and hyperscalers
Smith is persuasive that consumers may bear much of the adjustment. Natural gas frequently sets the marginal electricity price. Higher gas prices can therefore raise power costs beyond the generation directly supplied by gas. Hyperscalers face two risks: their electricity costs increase, and projects are delayed because firm power or gas transportation is unavailable. Financial hedges can protect prices. They cannot create physical gas or transmission capacity.
What must be true for Smith’s thesis to work
The strongest version of the thesis requires most of the following:
1. U.S. LNG capacity and feedgas demand approach the high end of current project expectations by 2030.
2. Data-center electricity demand reaches the upper half of the LBNL range.
3. Natural gas supplies a large portion of incremental data-center power.
4. U.S. production struggles to rise materially above 125-130 Bcf/d.
5. Permian associated gas does not provide enough incremental supply.
6. Appalachian pipeline capacity remains constrained.
7. Haynesville and Western Haynesville development requires materially higher prices.
8. Gathering and processing investment lags drilling requirements.
9. Canadian imports cannot increase enough to close the gap.
10. Storage enters 2028 without a large surplus.
11. LNG contracts and international prices keep export utilization high.
12. Demand response does not occur until prices rise substantially.
Smith does not need every condition to be correct. But the literal storage-collapse outcome requires a large majority of them.
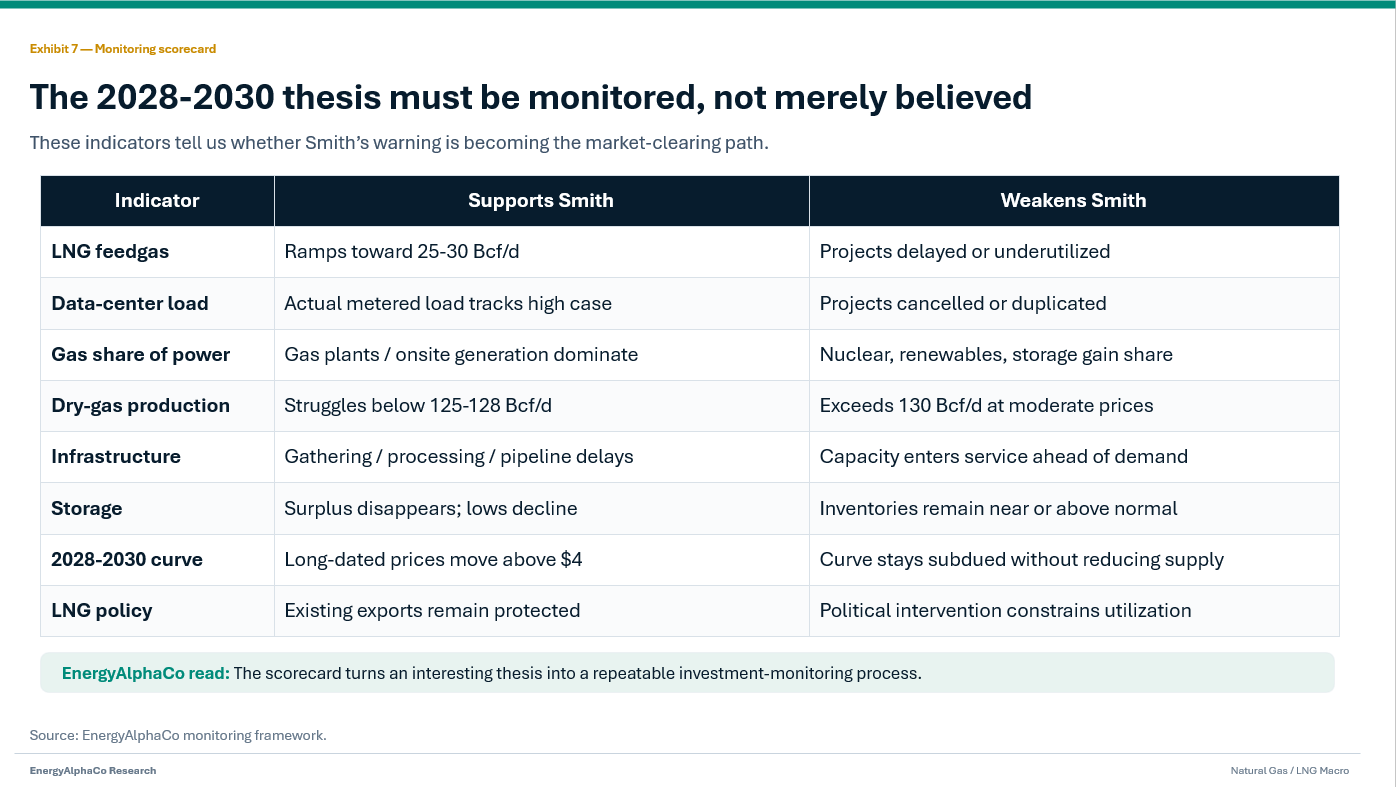
EnergyAlphaCo monitoring scorecard
Thesis breakers
Smith’s thesis would be materially weakened by any combination of the following:
· EIA’s 27.7 Bcf/d LNG-capacity outlook proves closer to reality than the 35 Bcf/d assumption.
· Actual LNG feedgas demand remains well below nameplate capacity.
· Data-center electricity consumption lands near the lower end of the LBNL range.
· Less than half of incremental data-center power is supplied by natural gas.
· U.S. production exceeds approximately 130 Bcf/d before 2030 without requiring sustained $5-plus gas.
· Permian associated gas expands rapidly as takeaway capacity increases.
· Appalachian pipeline additions unlock substantial low-cost production.
· Storage remains near or above normal through 2028.
· Data-center developers delay projects because of power, financing or equipment constraints.
· Industrial and power-sector demand respond at lower prices than Smith assumes.
· LNG project delays push feedgas growth beyond 2030.
· Policy intervention limits export utilization before storage reaches critical levels.
Final assessment
Matt Smith has identified a genuine and potentially underpriced problem.
The United States is entering a period when LNG exports and electricity demand may rise faster than the physical gas system can expand. Production must overcome legacy declines. The best drilling inventory is finite. Infrastructure takes years to permit and construct. Data centers require firm power at specific locations rather than theoretical generation somewhere else on the grid.
Those observations are well supported.
The more dramatic claims remain unproven.
The 35 Bcf/d LNG-capacity assumption is above EIA’s current 2030 estimate. The 5 Bcf/d AI-demand estimate is plausible but requires a gas-intensive outcome. The 128-132 Bcf/d production ceiling depends on a proprietary well-level model that cannot yet be independently reconstructed. And a literal storage collapse assumes too little response from prices, drilling, imports, exports and demand.
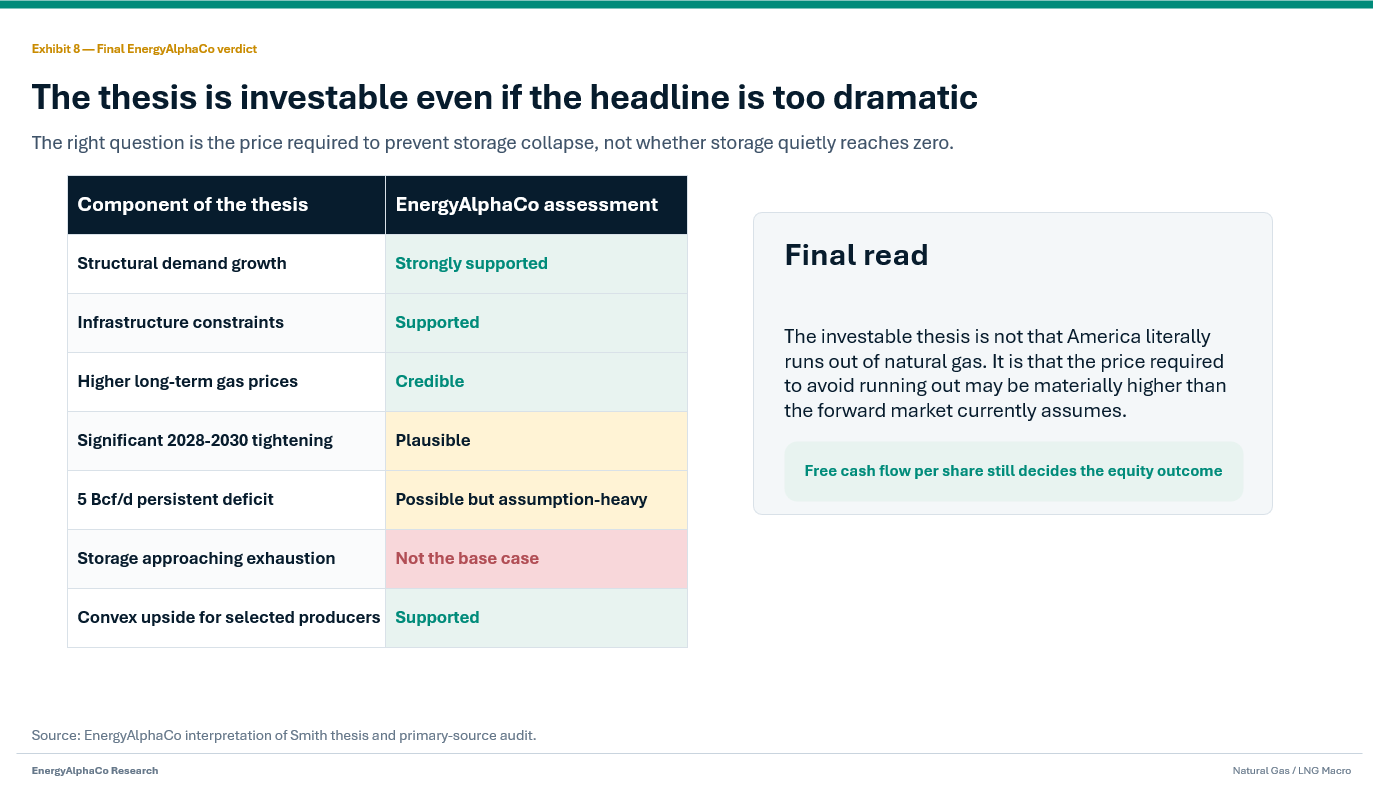
The investable thesis is not that America literally runs out of natural gas. It is that the price required to avoid running out may be materially higher than the forward market currently assumes.
The best gas equities will not simply own large resources. They will own deliverable, low-cost inventory; maintain manageable balance sheets; control dilution; and convert higher commodity prices into rising free cash flow per fully diluted share.
That is the question EnergyAlphaCo will continue auditing.
Sources and research attribution
This article evaluates the thesis attributed to Matt Smith in the two supplied research summaries, including AI Needs More Natural Gas Than America Has and US Natural Gas Storage Could Collapse Entirely by 2029. The summaries appear to derive substantially from the same underlying interview and model and are therefore treated as two presentations of one thesis rather than independent corroborating sources.
Primary verification sources include the U.S. Energy Information Administration’s July 2026 Short-Term Energy Outlook and 2026 Annual Energy Outlook, Federal Energy Regulatory Commission LNG project data, Lawrence Berkeley National Laboratory’s data-center electricity report and PJM’s 2026 load forecast.
Investment-risk and ownership disclosure
This material is provided for informational and educational purposes only and does not constitute individualized investment advice, a recommendation to buy or sell any security, or an offer or solicitation to transact in securities.
Energy and commodity investments involve substantial risk, including commodity-price volatility, operational failures, project delays, reserve and inventory uncertainty, regulatory changes, leverage, capital intensity and equity dilution. Forecasts and scenarios may prove incorrect.
The author owns shares of Comstock Resources. This financial interest may create a potential conflict of interest. Readers should conduct their own research and evaluate their objectives, financial circumstances and risk tolerance before making investment decisions.