
Baker Hughes: What Must Be Proven Before a Full Thesis Audit?
A pre-audit assessment of Baker Hughes after record IET orders and the acquisition of Chart Industries
Initial classification: Watchlist / Potential Thesis Audit Candidate

Why Baker Hughes is on the watchlist
Baker Hughes is no longer adequately described as a traditional oilfield-services company. Before the Chart Industries acquisition, Oilfield Services & Equipment (OFSE) represented approximately 52% of 2025 revenue, while Industrial & Energy Technology (IET) represented 48%. Within IET, gas technology accounted for approximately 72% of revenue, with LNG representing the largest individual end market.
That mix is shifting further. Baker Hughes completed its $13.6 billion acquisition of Chart Industries on July 16, 2026. Chart generated $4.3 billion of revenue in 2025 and adds thermal management, air and gas handling, compression and lifecycle-service capabilities across gas infrastructure, data centers, nuclear, carbon capture, geothermal and other industrial markets. Chart will operate as Baker Hughes’ third reporting segment beginning in the third quarter.
The attraction is straightforward: Baker Hughes may become one of the few large public companies able to participate across natural-gas production, LNG liquefaction, gas transportation, onsite power generation, data-center infrastructure and equipment servicing. The unresolved issue is whether that opportunity will translate into higher free cash flow per diluted share after acquisition debt, integration spending and manufacturing capital.
The company in one paragraph
Post-acquisition Baker Hughes has three principal businesses. OFSE provides drilling, completions, production, subsea and other oilfield equipment and services. IET supplies gas turbines, compressors, LNG equipment, power-generation systems, industrial equipment, digital products and lifecycle services. Chart adds cryogenic, heat-transfer, air and gas handling, thermal-management and related aftermarket capabilities. The combined company has greater exposure to long-duration infrastructure spending than a conventional North American service company, but remains exposed to upstream capital cycles, large-project execution, manufacturing capacity, customer timing and geopolitical disruption.
The basic investment question
Can Baker Hughes convert its LNG, gas-infrastructure and power-generation backlog—together with Chart—into durable free-cash-flow growth per share while reducing leverage?
That question matters more than whether AI power demand, LNG capacity or natural-gas infrastructure spending grows. Those markets can expand while Baker Hughes still produces an inadequate shareholder return if:
Equipment margins disappoint or projects are delayed or canceled.
Manufacturing capacity becomes expensive to expand.
Chart integration costs exceed the expected synergies.
Interest and debt repayment consume the incremental cash flow.
The market has already priced in most of the expected transformation.
What looks interesting
1. Commercial momentum is supported by actual orders
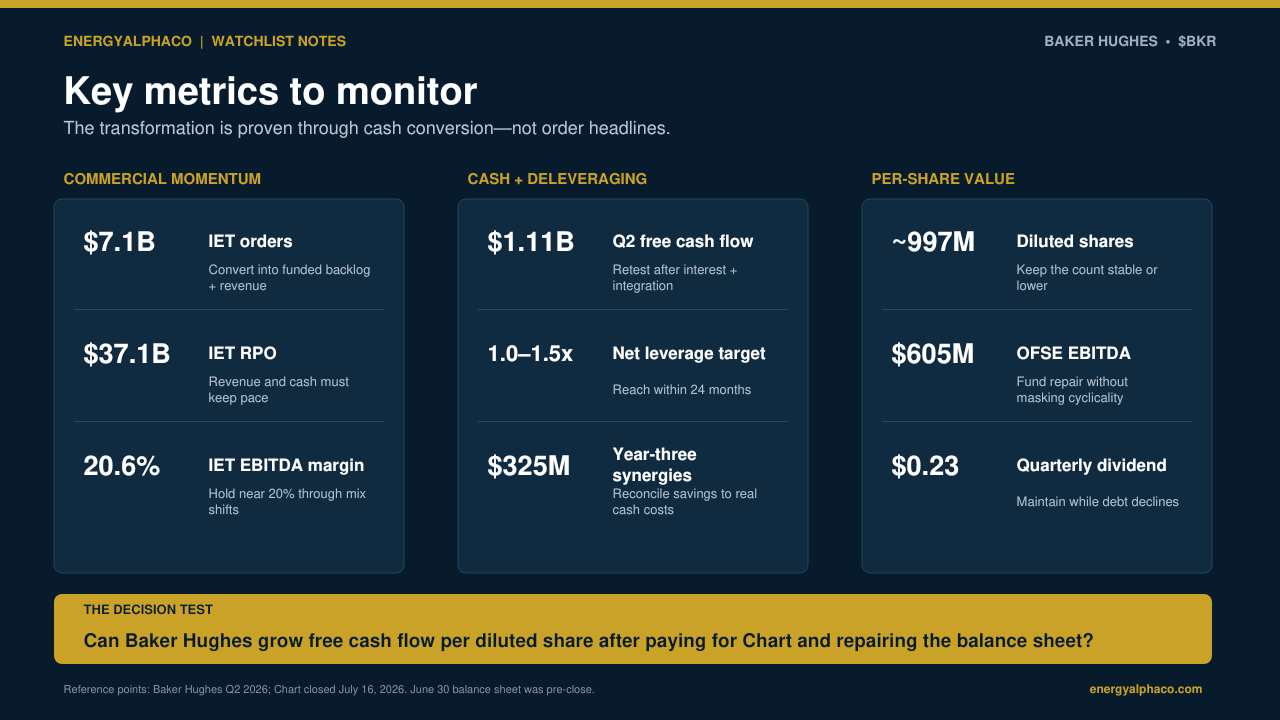
Baker Hughes reported second-quarter orders of $10.5 billion, up 49% from the prior-year quarter. IET orders reached a record $7.1 billion, with IET remaining performance obligations (RPO) rising to $37.1 billion. IET’s quarterly book-to-bill ratio was approximately 2.2 times.
Recent awards included 1.3 gigawatts of NovaLT16 mobile power equipment for Dynamis; an agreement with Kodiak Gas Services for up to 1.8 gigawatts; six liquefaction blocks for Venture Global’s CP2 expansion; compressor trains for Golar LNG; and liquefaction equipment and fleet upgrades for Cheniere’s Sabine Pass.
2. IET is becoming the economic center of the company
Second-quarter IET revenue was $3.29 billion and segment EBITDA was $678 million, producing a 20.6% margin. EBITDA increased 16% year over year and the margin expanded by 280 basis points. At quarter-end, Baker Hughes reported $16.7 billion of Gas Technology Services RPO, compared with $15.0 billion of Gas Technology Equipment RPO.
The developing case is not only that Baker Hughes will sell more turbines and compressors. Each installed unit may create a long-duration stream of upgrades, maintenance, digital monitoring, spare parts and other lifecycle revenue. That recurring-revenue argument is credible, but still needs to be demonstrated in consolidated cash flow.
3. Power demand is becoming a direct operating opportunity
Baker Hughes is positioning a power portfolio ranging from 12-megawatt NovaLT turbines to larger aeroderivative and heavy-duty units for grid-connected, mobile and behind-the-meter generation. Management estimates that Power Systems could address an annual market of approximately $100 billion by 2030 and cites data-center power demand growing roughly 18% annually through 2030. These are management and third-party market estimates—not Baker Hughes revenue guidance. The evidence that matters is whether announced gigawatt orders become revenue, margin and cash on schedule.
4. Chart provides more than simple revenue growth
Management expects Chart to expand Baker Hughes’ installed base, aftermarket reach and exposure to gas infrastructure, carbon capture, geothermal and data centers. It targets annualized cost synergies of $95 million by the end of year one, $230 million by year two and $325 million by year three. Management has also projected more than 10% adjusted EPS accretion in the first full year after closing, excluding potential commercial synergies. These are measurable claims that create a clear future audit trail.
5. Management incentives include cash returns and capital efficiency
Baker Hughes’ 2025 annual incentive framework included revenue, adjusted EBITDA, margin, free cash flow and free-cash-flow conversion. Long-term performance units were based on relative free-cash-flow conversion and return on invested capital, with a total-shareholder-return modifier. That is constructive, but the post-Chart structure must continue to emphasize ROIC and cash conversion rather than acquisition-driven scale.
What must be proven
The post-acquisition balance sheet
The June 30 balance sheet showed $15.7 billion of cash and $16.3 billion of debt, but it is not representative of the post-Chart company: Baker Hughes had already issued most acquisition debt and had not yet deployed the cash to close. The acquisition was funded with cash on hand, $6.5 billion of dollar-denominated notes, €3 billion of euro-denominated notes and $2 billion of two-year term loans. Management targets net leverage of 1.0–1.5 times within 24 months. That remains a target—not an accomplished fact.
Free cash flow after all Chart-related cash costs
Baker Hughes generated $1.11 billion of free cash flow in the second quarter and $1.21 billion during the first half. Quarterly cash generation was strong but benefited from working-capital timing, including customer progress collections and deferred income. The 2026 free-cash-flow conversion framework excludes certain interest and other cash costs associated with closing Chart. EnergyAlphaCo will therefore focus on cash generated after capital expenditures, cash interest, taxes, integration costs, restructuring and other acquisition-related payments.
Backlog conversion at attractive margins
A record backlog does not automatically equal economic value. Equipment must be delivered on schedule; customer advances must convert into profitable revenue; capacity additions must earn adequate returns; and inflation, supply-chain costs and competition must not absorb pricing. Rising RPO accompanied by delayed revenue, higher working capital or weaker margins would be an early warning sign.
Verifiable Chart synergies
Investors should require a recurring bridge showing savings achieved, integration costs incurred, facility consolidations, purchasing and logistics savings, employee retention, revenue lost through divestitures or disruption, and incremental aftermarket or cross-selling revenue. Adjusted EPS accretion alone is insufficient because financing choices, acquisition accounting and adjustments can obscure underlying return on invested capital.
Per-share value creation
Baker Hughes had approximately 992.7 million common shares outstanding as of July 23, while second-quarter diluted weighted-average shares were approximately 997 million. The Chart acquisition was predominantly cash-funded, limiting immediate transaction dilution. Investors should still monitor stock compensation, converted Chart employee awards and whether future repurchases do more than offset employee issuance.
What could make EnergyAlphaCo pass
Net leverage does not move decisively toward 1.0–1.5 times within 24 months.
Reported free-cash-flow conversion remains strong only because Chart-related interest and integration costs are excluded.
IET orders remain elevated but backlog conversion, working capital or equipment margins deteriorate.
Chart’s annualized savings materially trail the $95 million, $230 million and $325 million milestones.
Asset sales remove more durable earnings than investors initially expected.
Substantial buybacks resume before the balance sheet is repaired.
OFSE weakness offsets IET and Chart growth.
Data-center power orders prove to be delayed or unfunded rather than equipment deliveries.
The stock rerates before post-acquisition cash flow catches up.
High-level valuation question
At roughly $60 per share at the time of this review, Baker Hughes carried an equity value of approximately $60 billion. Outside research supplied for context spans the debate: one view argues that investors still apply an oilfield-services valuation to an increasingly industrial company; another estimates fair value near the prevailing share price; and a third emphasizes elevated Chart integration and deleveraging risk. These opinions frame the questions but are not evidence.
A future Thesis Audit must determine whether normalized post-Chart free cash flow supports the valuation without requiring perfect integration, sustained record orders and aggressive multiple expansion.
What would justify a full Thesis Audit?
A full Baker Hughes Thesis Audit should begin after two missing pieces become available:
Pro forma Chart financial information, including post-close debt, purchase accounting and combined income-statement effects.
The first full quarter of Chart segment reporting, including revenue, EBITDA, cash requirements and integration costs.
At that point, EnergyAlphaCo can reconstruct pro forma net debt and cash interest, combined EBITDA, true free cash flow after acquisition costs, synergy timing, normalized capital expenditures and working capital, fully diluted shares, sum-of-the-parts valuation, and the cash-flow growth required to justify the share price.
Initial classification
WATCHLIST / POTENTIAL THESIS AUDIT CANDIDATE
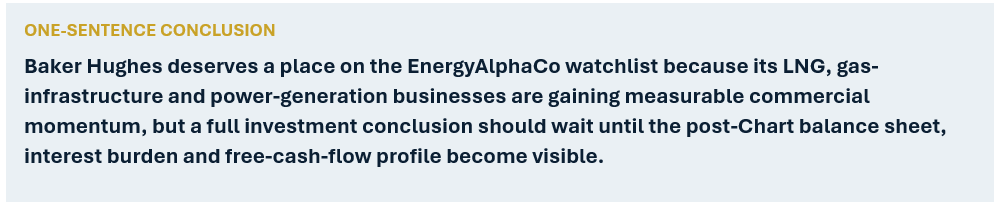
Baker Hughes has enough verified commercial momentum and strategic relevance to justify deeper coverage. It does not yet have enough post-acquisition financial disclosure to justify a confident valuation conclusion.
Final assessment
Baker Hughes may be one of the more strategically important companies in EnergyAlphaCo’s coverage universe. It supplies equipment and services required to produce natural gas, liquefy it, transport it, convert it into power and maintain the resulting infrastructure. That creates exposure to LNG expansion, energy security, data-center load growth and demand for dispatchable generation.
But the central investment question is not whether those markets are attractive. It is whether Baker Hughes can turn them into durable free cash flow per diluted share after paying for Chart and repairing the balance sheet. That has not yet been proven.